

single state wave function for each molecule. Of the main group diatomics, triplet
O 2 exhibits the most multireference character throughout the entire calculated PEC.
Even at equilibrium, the T 1 /D 1 values for triplet O 2 approach the multireference
threshold, while the CCSD amplitudes do not even converge further towards dissociation (i.e. 3.5 Å). This is indicative of significant multireference character in
this area of the curve due to the breaking of the bonds and demonstrates that the
single reference wave function determined with HF is not a suitable reference. The
multireference character is manifested by the oscillation between different states
throughout the entire curve (see Fig. 1).
Table 2 T 1 /D 1 diagnostics
for the main group molecules
r (Å)
O 2
1.1
1.3
2.1
3.3
T 1
0.011
0.017
0.037
–
D 1
0.031
0.047
0.097
–
F 2
1.1
1.3
1.8
2.5
T 1
0.008
0.009
0.018
0.030
D 1
0.016
0.023
0.059
0.105
Cl 2
1.6
2.0
2.7
3.5
T 1
0.008
0.009
0.014
0.022
D 1
0.017
0.022
0.045
0.080
Br 2
1.8
2.3
3.0
3.7
T 1
0.007
0.008
0.013
0.020
D 1
0.014
0.019
0.041
0.071
For O 2 at 3.3 Å, the CCSD amplitudes did not converge, which is
an indication of either significant multireference character or a
poor reference wavefunction
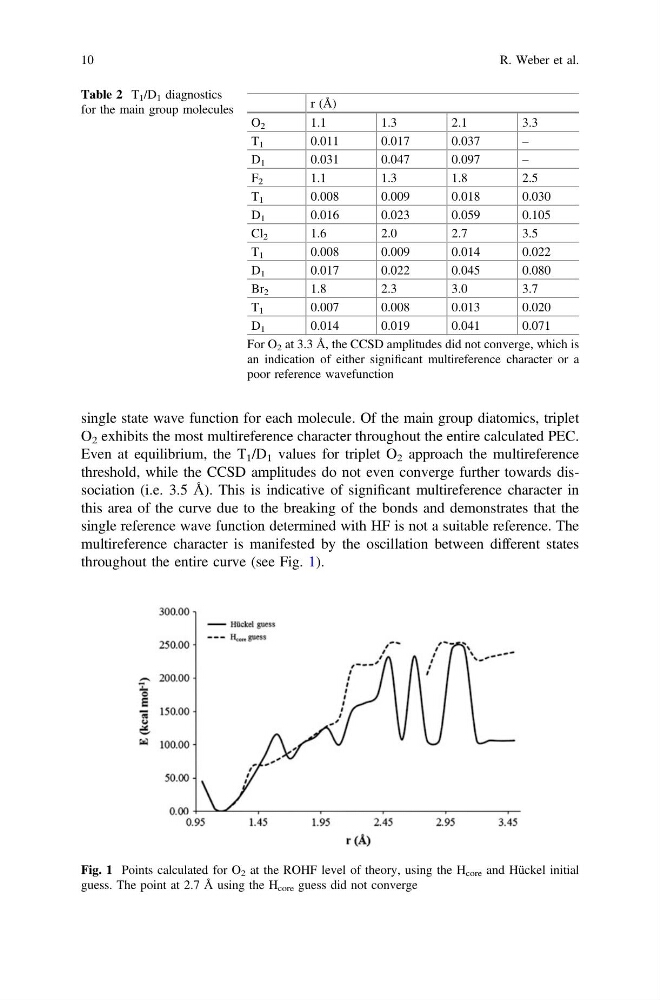
Fig. 1 Points calculated for O 2 at the ROHF level of theory, using the H core and Hückel initial
guess. The point at 2.7 Å using the H core guess did not converge
10
R. Weber et al.
O 2 exhibits the most multireference character throughout the entire calculated PEC.
Even at equilibrium, the T 1 /D 1 values for triplet O 2 approach the multireference
threshold, while the CCSD amplitudes do not even converge further towards dissociation (i.e. 3.5 Å). This is indicative of significant multireference character in
this area of the curve due to the breaking of the bonds and demonstrates that the
single reference wave function determined with HF is not a suitable reference. The
multireference character is manifested by the oscillation between different states
throughout the entire curve (see Fig. 1).
Table 2 T 1 /D 1 diagnostics
for the main group molecules
r (Å)
O 2
1.1
1.3
2.1
3.3
T 1
0.011
0.017
0.037
–
D 1
0.031
0.047
0.097
–
F 2
1.1
1.3
1.8
2.5
T 1
0.008
0.009
0.018
0.030
D 1
0.016
0.023
0.059
0.105
Cl 2
1.6
2.0
2.7
3.5
T 1
0.008
0.009
0.014
0.022
D 1
0.017
0.022
0.045
0.080
Br 2
1.8
2.3
3.0
3.7
T 1
0.007
0.008
0.013
0.020
D 1
0.014
0.019
0.041
0.071
For O 2 at 3.3 Å, the CCSD amplitudes did not converge, which is
an indication of either significant multireference character or a
poor reference wavefunction
Fig. 1 Points calculated for O 2 at the ROHF level of theory, using the H core and Hückel initial
guess. The point at 2.7 Å using the H core guess did not converge
10
R. Weber et al.