

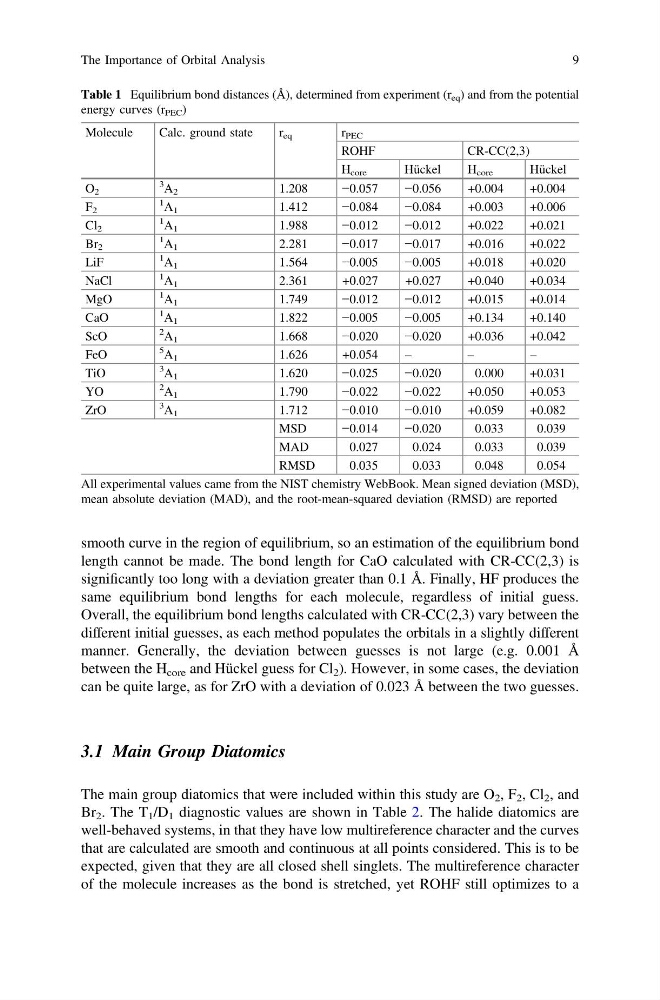
smooth curve in the region of equilibrium, so an estimation of the equilibrium bond
length cannot be made. The bond length for CaO calculated with CR-CC(2,3) is
significantly too long with a deviation greater than 0.1 Å. Finally, HF produces the
same equilibrium bond lengths for each molecule, regardless of initial guess.
Overall, the equilibrium bond lengths calculated with CR-CC(2,3) vary between the
different initial guesses, as each method populates the orbitals in a slightly different
manner. Generally, the deviation between guesses is not large (e.g. 0.001 Å
between the H core and Hückel guess for Cl 2 ). However, in some cases, the deviation
can be quite large, as for ZrO with a deviation of 0.023 Å between the two guesses.
3.1 Main Group Diatomics
The main group diatomics that were included within this study are O 2 , F 2 , Cl 2 , and
Br 2 . The T 1 /D 1 diagnostic values are shown in Table 2. The halide diatomics are
well-behaved systems, in that they have low multireference character and the curves
that are calculated are smooth and continuous at all points considered. This is to be
expected, given that they are all closed shell singlets. The multireference character
of the molecule increases as the bond is stretched, yet ROHF still optimizes to a
Table 1 Equilibrium bond distances (Å), determined from experiment (r eq ) and from the potential
energy curves (r PEC )
Molecule
Calc. ground state
r eq
r PEC
ROHF
CR-CC(2,3)
H core
Hückel
H core
Hückel
O 2
3
A 2
1.208
−0.057
−0.056
+0.004
+0.004
F 2
1
A 1
1.412
−0.084
−0.084
+0.003
+0.006
Cl 2
1
A 1
1.988
−0.012
−0.012
+0.022
+0.021
Br 2
1
A 1
2.281
−0.017
−0.017
+0.016
+0.022
LiF
1
A 1
1.564
−0.005
−0.005
+0.018
+0.020
NaCl
1
A 1
2.361
+0.027
+0.027
+0.040
+0.034
MgO
1
A 1
1.749
−0.012
−0.012
+0.015
+0.014
CaO
1
A 1
1.822
−0.005
−0.005
+0.134
+0.140
ScO
2
A 1
1.668
−0.020
−0.020
+0.036
+0.042
FeO
5
A 1
1.626
+0.054
–
–
–
TiO
3
A 1
1.620
−0.025
−0.020
0.000
+0.031
YO
2
A 1
1.790
−0.022
−0.022
+0.050
+0.053
ZrO
3
A 1
1.712
−0.010
−0.010
+0.059
+0.082
MSD
−0.014
−0.020
0.033
0.039
MAD
0.027
0.024
0.033
0.039
RMSD
0.035
0.033
0.048
0.054
All experimental values came from the NIST chemistry WebBook. Mean signed deviation (MSD),
mean absolute deviation (MAD), and the root-mean-squared deviation (RMSD) are reported
The Importance of Orbital Analysis
9
length cannot be made. The bond length for CaO calculated with CR-CC(2,3) is
significantly too long with a deviation greater than 0.1 Å. Finally, HF produces the
same equilibrium bond lengths for each molecule, regardless of initial guess.
Overall, the equilibrium bond lengths calculated with CR-CC(2,3) vary between the
different initial guesses, as each method populates the orbitals in a slightly different
manner. Generally, the deviation between guesses is not large (e.g. 0.001 Å
between the H core and Hückel guess for Cl 2 ). However, in some cases, the deviation
can be quite large, as for ZrO with a deviation of 0.023 Å between the two guesses.
3.1 Main Group Diatomics
The main group diatomics that were included within this study are O 2 , F 2 , Cl 2 , and
Br 2 . The T 1 /D 1 diagnostic values are shown in Table 2. The halide diatomics are
well-behaved systems, in that they have low multireference character and the curves
that are calculated are smooth and continuous at all points considered. This is to be
expected, given that they are all closed shell singlets. The multireference character
of the molecule increases as the bond is stretched, yet ROHF still optimizes to a
Table 1 Equilibrium bond distances (Å), determined from experiment (r eq ) and from the potential
energy curves (r PEC )
Molecule
Calc. ground state
r eq
r PEC
ROHF
CR-CC(2,3)
H core
Hückel
H core
Hückel
O 2
3
A 2
1.208
−0.057
−0.056
+0.004
+0.004
F 2
1
A 1
1.412
−0.084
−0.084
+0.003
+0.006
Cl 2
1
A 1
1.988
−0.012
−0.012
+0.022
+0.021
Br 2
1
A 1
2.281
−0.017
−0.017
+0.016
+0.022
LiF
1
A 1
1.564
−0.005
−0.005
+0.018
+0.020
NaCl
1
A 1
2.361
+0.027
+0.027
+0.040
+0.034
MgO
1
A 1
1.749
−0.012
−0.012
+0.015
+0.014
CaO
1
A 1
1.822
−0.005
−0.005
+0.134
+0.140
ScO
2
A 1
1.668
−0.020
−0.020
+0.036
+0.042
FeO
5
A 1
1.626
+0.054
–
–
–
TiO
3
A 1
1.620
−0.025
−0.020
0.000
+0.031
YO
2
A 1
1.790
−0.022
−0.022
+0.050
+0.053
ZrO
3
A 1
1.712
−0.010
−0.010
+0.059
+0.082
MSD
−0.014
−0.020
0.033
0.039
MAD
0.027
0.024
0.033
0.039
RMSD
0.035
0.033
0.048
0.054
All experimental values came from the NIST chemistry WebBook. Mean signed deviation (MSD),
mean absolute deviation (MAD), and the root-mean-squared deviation (RMSD) are reported
The Importance of Orbital Analysis
9