

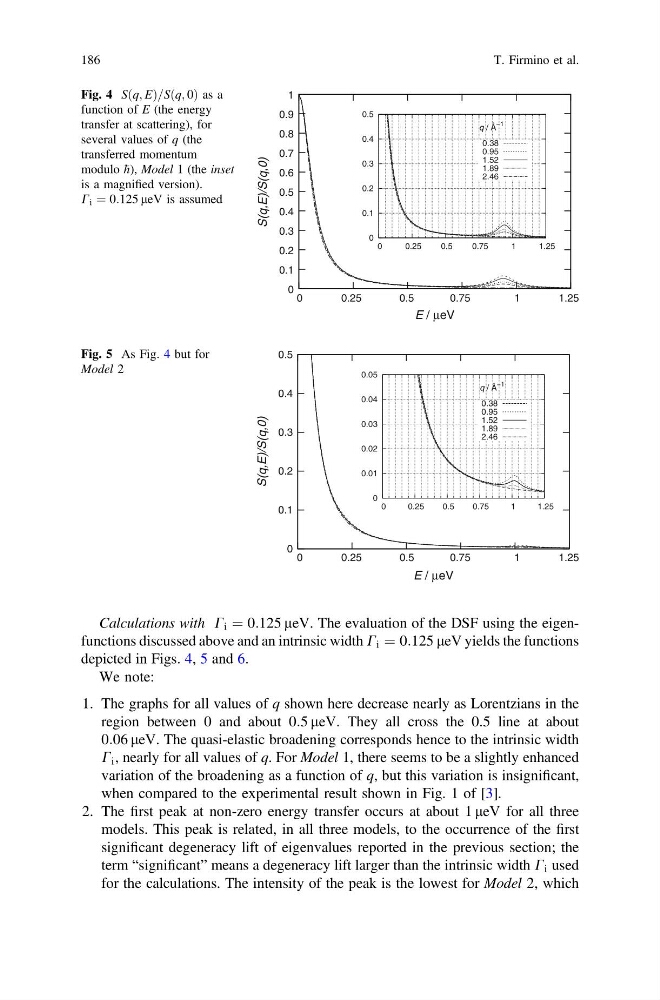
Calculations with C i ¼ 0:125 leV. The evaluation of the DSF using the eigenfunctions discussed above and an intrinsic width C i ¼ 0:125 leV yields the functions
depicted in Figs. 4, 5 and 6.
We note:
1. The graphs for all values of q shown here decrease nearly as Lorentzians in the
region between 0 and about 0:5 leV. They all cross the 0.5 line at about
0:06 leV. The quasi-elastic broadening corresponds hence to the intrinsic width
C i , nearly for all values of q. For Model 1, there seems to be a slightly enhanced
variation of the broadening as a function of q, but this variation is insignificant,
when compared to the experimental result shown in Fig. 1 of [3].
2. The first peak at non-zero energy transfer occurs at about 1 leV for all three
models. This peak is related, in all three models, to the occurrence of the first
significant degeneracy lift of eigenvalues reported in the previous section; the
term “significant” means a degeneracy lift larger than the intrinsic width C i used
for the calculations. The intensity of the peak is the lowest for Model 2, which
0
0.1
0.2
0.3
0.4
0.5
0.6
0.7
0.8
0.9
1
0
0.25
0.5
0.75
1
1.25
S(q,E)/S(q,0)
E / μeV
0
0.1
0.2
0.3
0.4
0.5
0
0.25
0.5
0.75
1
1.25
q / Å
−1
0.38
0.95
1.52
1.89
2.46
Fig. 4 Sðq; EÞ=Sðq; 0Þ as a
function of E (the energy
transfer at scattering), for
several values of q (the
transferred momentum
modulo h), Model 1 (the inset
is a magnified version).
C i ¼ 0:125 leV is assumed
0
0.1
0.2
0.3
0.4
0.5
0
0.25
0.5
0.75
1
1.25
S(q,E)/S(q,0)
E / μeV
0
0.01
0.02
0.03
0.04
0.05
0
0.25
0.5
0.75
1
1.25
q / Å
−1
0.38
0.95
1.52
1.89
2.46
Fig. 5 As Fig. 4 but for
Model 2
186
T. Firmino et al.
depicted in Figs. 4, 5 and 6.
We note:
1. The graphs for all values of q shown here decrease nearly as Lorentzians in the
region between 0 and about 0:5 leV. They all cross the 0.5 line at about
0:06 leV. The quasi-elastic broadening corresponds hence to the intrinsic width
C i , nearly for all values of q. For Model 1, there seems to be a slightly enhanced
variation of the broadening as a function of q, but this variation is insignificant,
when compared to the experimental result shown in Fig. 1 of [3].
2. The first peak at non-zero energy transfer occurs at about 1 leV for all three
models. This peak is related, in all three models, to the occurrence of the first
significant degeneracy lift of eigenvalues reported in the previous section; the
term “significant” means a degeneracy lift larger than the intrinsic width C i used
for the calculations. The intensity of the peak is the lowest for Model 2, which
0
0.1
0.2
0.3
0.4
0.5
0.6
0.7
0.8
0.9
1
0
0.25
0.5
0.75
1
1.25
S(q,E)/S(q,0)
E / μeV
0
0.1
0.2
0.3
0.4
0.5
0
0.25
0.5
0.75
1
1.25
q / Å
−1
0.38
0.95
1.52
1.89
2.46
Fig. 4 Sðq; EÞ=Sðq; 0Þ as a
function of E (the energy
transfer at scattering), for
several values of q (the
transferred momentum
modulo h), Model 1 (the inset
is a magnified version).
C i ¼ 0:125 leV is assumed
0
0.1
0.2
0.3
0.4
0.5
0
0.25
0.5
0.75
1
1.25
S(q,E)/S(q,0)
E / μeV
0
0.01
0.02
0.03
0.04
0.05
0
0.25
0.5
0.75
1
1.25
q / Å
−1
0.38
0.95
1.52
1.89
2.46
Fig. 5 As Fig. 4 but for
Model 2
186
T. Firmino et al.