

3.1 Root Mean Square Deviation (RMSD) Analysis
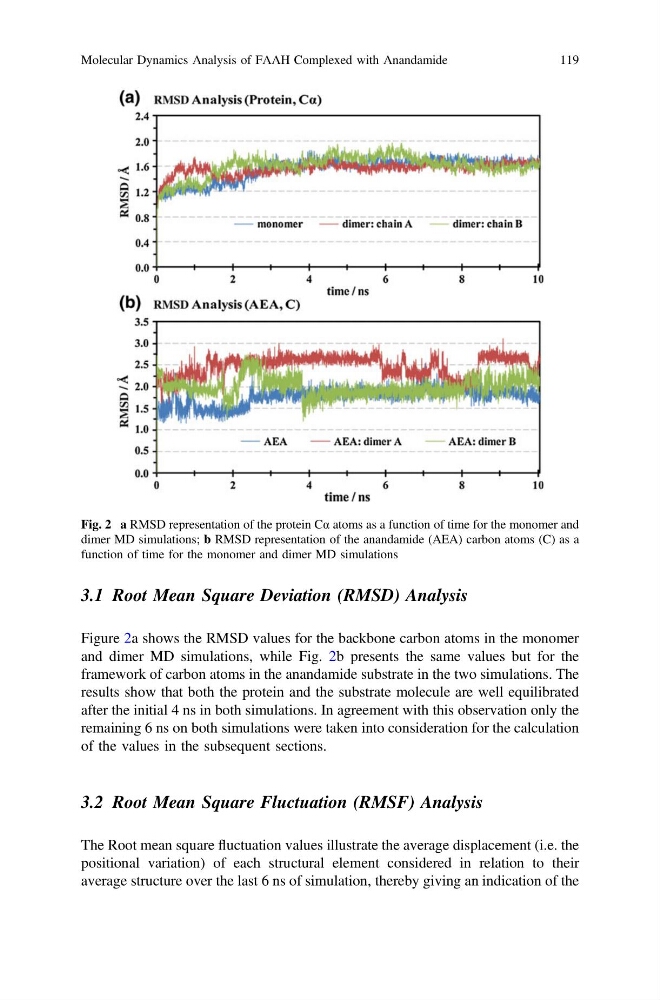
Figure 2a shows the RMSD values for the backbone carbon atoms in the monomer
and dimer MD simulations, while Fig. 2b presents the same values but for the
framework of carbon atoms in the anandamide substrate in the two simulations. The
results show that both the protein and the substrate molecule are well equilibrated
after the initial 4 ns in both simulations. In agreement with this observation only the
remaining 6 ns on both simulations were taken into consideration for the calculation
of the values in the subsequent sections.
3.2 Root Mean Square Fluctuation (RMSF) Analysis
The Root mean square fluctuation values illustrate the average displacement (i.e. the
positional variation) of each structural element considered in relation to their
average structure over the last 6 ns of simulation, thereby giving an indication of the
Fig. 2 a RMSD representation of the protein Cα atoms as a function of time for the monomer and
dimer MD simulations; b RMSD representation of the anandamide (AEA) carbon atoms (C) as a
function of time for the monomer and dimer MD simulations
Molecular Dynamics Analysis of FAAH Complexed with Anandamide
119
Figure 2a shows the RMSD values for the backbone carbon atoms in the monomer
and dimer MD simulations, while Fig. 2b presents the same values but for the
framework of carbon atoms in the anandamide substrate in the two simulations. The
results show that both the protein and the substrate molecule are well equilibrated
after the initial 4 ns in both simulations. In agreement with this observation only the
remaining 6 ns on both simulations were taken into consideration for the calculation
of the values in the subsequent sections.
3.2 Root Mean Square Fluctuation (RMSF) Analysis
The Root mean square fluctuation values illustrate the average displacement (i.e. the
positional variation) of each structural element considered in relation to their
average structure over the last 6 ns of simulation, thereby giving an indication of the
Fig. 2 a RMSD representation of the protein Cα atoms as a function of time for the monomer and
dimer MD simulations; b RMSD representation of the anandamide (AEA) carbon atoms (C) as a
function of time for the monomer and dimer MD simulations
Molecular Dynamics Analysis of FAAH Complexed with Anandamide
119