

overprint. In the kinetic models, reactive surface areas
are commonly regarded as a highly uncertain parameter. Knowledge on how much of the surfaces of reactive minerals (e.g. feldspars and chlorites) are in
contact with the formation water (provides the specific
surface area as m
2
/L porewater) is therefore essential.
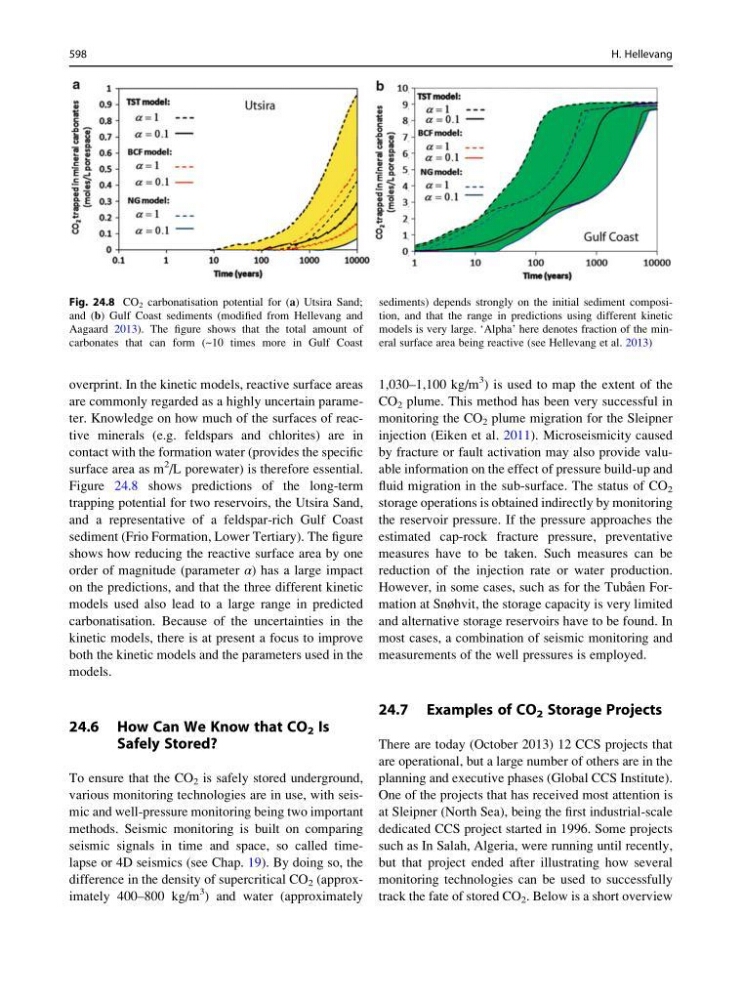
Figure 24.8 shows predictions of the long-term
trapping potential for two reservoirs, the Utsira Sand,
and a representative of a feldspar-rich Gulf Coast
sediment (Frio Formation, Lower Tertiary). The figure
shows how reducing the reactive surface area by one
order of magnitude (parameter α) has a large impact
on the predictions, and that the three different kinetic
models used also lead to a large range in predicted
carbonatisation. Because of the uncertainties in the
kinetic models, there is at present a focus to improve
both the kinetic models and the parameters used in the
models.
24.6 How Can We Know that CO 2 Is
Safely Stored?
To ensure that the CO 2 is safely stored underground,
various monitoring technologies are in use, with seismic and well-pressure monitoring being two important
methods. Seismic monitoring is built on comparing
seismic signals in time and space, so called timelapse or 4D seismics (see Chap. 19). By doing so, the
difference in the density of supercritical CO 2 (approximately 400–800 kg/m
3 ) and water (approximately
1,030–1,100 kg/m
3 ) is used to map the extent of the
CO 2 plume. This method has been very successful in
monitoring the CO 2 plume migration for the Sleipner
injection (Eiken et al. 2011). Microseismicity caused
by fracture or fault activation may also provide valuable information on the effect of pressure build-up and
fluid migration in the sub-surface. The status of CO 2
storage operations is obtained indirectly by monitoring
the reservoir pressure. If the pressure approaches the
estimated cap-rock fracture pressure, preventative
measures have to be taken. Such measures can be
reduction of the injection rate or water production.
However, in some cases, such as for the Tuba ˚en Formation at Snøhvit, the storage capacity is very limited
and alternative storage reservoirs have to be found. In
most cases, a combination of seismic monitoring and
measurements of the well pressures is employed.
24.7 Examples of CO 2 Storage Projects
There are today (October 2013) 12 CCS projects that
are operational, but a large number of others are in the
planning and executive phases (Global CCS Institute).
One of the projects that has received most attention is
at Sleipner (North Sea), being the first industrial-scale
dedicated CCS project started in 1996. Some projects
such as In Salah, Algeria, were running until recently,
but that project ended after illustrating how several
monitoring technologies can be used to successfully
track the fate of stored CO 2 . Below is a short overview
Fig. 24.8 CO 2 carbonatisation potential for (a) Utsira Sand;
and (b) Gulf Coast sediments (modified from Hellevang and
Aagaard 2013). The figure shows that the total amount of
carbonates that can form (~10 times more in Gulf Coast
sediments) depends strongly on the initial sediment composition, and that the range in predictions using different kinetic
models is very large. ‘Alpha’ here denotes fraction of the mineral surface area being reactive (see Hellevang et al. 2013)
598
H. Hellevang
are commonly regarded as a highly uncertain parameter. Knowledge on how much of the surfaces of reactive minerals (e.g. feldspars and chlorites) are in
contact with the formation water (provides the specific
surface area as m
2
/L porewater) is therefore essential.
Figure 24.8 shows predictions of the long-term
trapping potential for two reservoirs, the Utsira Sand,
and a representative of a feldspar-rich Gulf Coast
sediment (Frio Formation, Lower Tertiary). The figure
shows how reducing the reactive surface area by one
order of magnitude (parameter α) has a large impact
on the predictions, and that the three different kinetic
models used also lead to a large range in predicted
carbonatisation. Because of the uncertainties in the
kinetic models, there is at present a focus to improve
both the kinetic models and the parameters used in the
models.
24.6 How Can We Know that CO 2 Is
Safely Stored?
To ensure that the CO 2 is safely stored underground,
various monitoring technologies are in use, with seismic and well-pressure monitoring being two important
methods. Seismic monitoring is built on comparing
seismic signals in time and space, so called timelapse or 4D seismics (see Chap. 19). By doing so, the
difference in the density of supercritical CO 2 (approximately 400–800 kg/m
3 ) and water (approximately
1,030–1,100 kg/m
3 ) is used to map the extent of the
CO 2 plume. This method has been very successful in
monitoring the CO 2 plume migration for the Sleipner
injection (Eiken et al. 2011). Microseismicity caused
by fracture or fault activation may also provide valuable information on the effect of pressure build-up and
fluid migration in the sub-surface. The status of CO 2
storage operations is obtained indirectly by monitoring
the reservoir pressure. If the pressure approaches the
estimated cap-rock fracture pressure, preventative
measures have to be taken. Such measures can be
reduction of the injection rate or water production.
However, in some cases, such as for the Tuba ˚en Formation at Snøhvit, the storage capacity is very limited
and alternative storage reservoirs have to be found. In
most cases, a combination of seismic monitoring and
measurements of the well pressures is employed.
24.7 Examples of CO 2 Storage Projects
There are today (October 2013) 12 CCS projects that
are operational, but a large number of others are in the
planning and executive phases (Global CCS Institute).
One of the projects that has received most attention is
at Sleipner (North Sea), being the first industrial-scale
dedicated CCS project started in 1996. Some projects
such as In Salah, Algeria, were running until recently,
but that project ended after illustrating how several
monitoring technologies can be used to successfully
track the fate of stored CO 2 . Below is a short overview
Fig. 24.8 CO 2 carbonatisation potential for (a) Utsira Sand;
and (b) Gulf Coast sediments (modified from Hellevang and
Aagaard 2013). The figure shows that the total amount of
carbonates that can form (~10 times more in Gulf Coast
sediments) depends strongly on the initial sediment composition, and that the range in predictions using different kinetic
models is very large. ‘Alpha’ here denotes fraction of the mineral surface area being reactive (see Hellevang et al. 2013)
598
H. Hellevang