

To do this, information about prediction strength
for the new data is needed. In this way the value of the
new information can be quantified. When evaluating
prediction strength, the strong and weak sides of the
CSEM technique must be taken into consideration. On
the strong side is the ability to measure general resistivity variations, areal distribution of the resistivity
anomaly, and in some case also the thickness and
volume of the measured objects. The ability to map
these parameters is strongly dependent on acquisition
geometry and complexity of the subsurface. The
method’s weak sides are for example vertical resolution, depth conversion and strong attenuation with
depth.
Another important step in evaluating the prediction
strength of CSEM data is to perform a thorough sensitivity study including detailed forward modelling. Further, statistical performance data for similar CSEM
targets can be included and used in a risk modification
procedure.
However, the lack of significant performance data
is a challenge when using a relatively new data type
like CSEM data. In the ideal case all relevant subsurface scenarios that can explain the CSEM observations
should be included, also those not involving
hydrocarbons.
However, the performance data base can be
simplified, and the measured CSEM cases can be
divided into two categories: Right prediction or
Wrong prediction. Now, in a case were the geological
chance of success for a prospect is decided, it can
be modified by including CSEM data. If the Right/
Wrong ratio from the performance data base is
high the impact on the geological chance of success
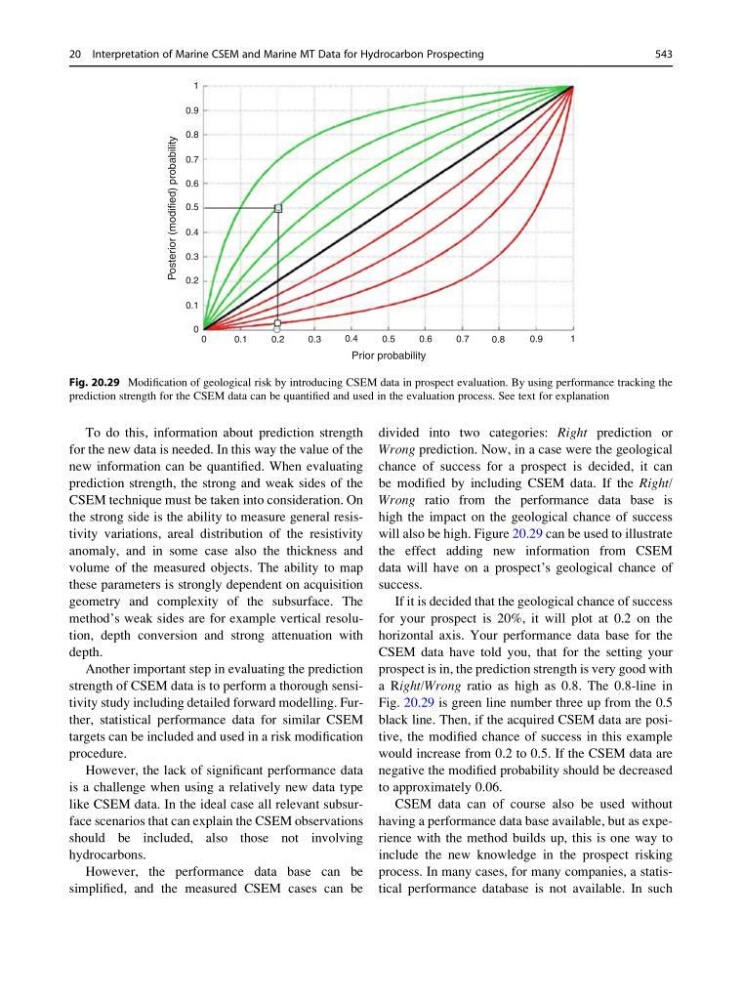
will also be high. Figure 20.29 can be used to illustrate
the effect adding new information from CSEM
data will have on a prospect’s geological chance of
success.
If it is decided that the geological chance of success
for your prospect is 20%, it will plot at 0.2 on the
horizontal axis. Your performance data base for the
CSEM data have told you, that for the setting your
prospect is in, the prediction strength is very good with
a Right/Wrong ratio as high as 0.8. The 0.8-line in
Fig. 20.29 is green line number three up from the 0.5
black line. Then, if the acquired CSEM data are positive, the modified chance of success in this example
would increase from 0.2 to 0.5. If the CSEM data are
negative the modified probability should be decreased
to approximately 0.06.
CSEM data can of course also be used without
having a performance data base available, but as experience with the method builds up, this is one way to
include the new knowledge in the prospect risking
process. In many cases, for many companies, a statistical performance database is not available. In such
1
1
0.9
0.9
0.8
0.8
0.7
0.7
0.6
0.6
0.5
0.5
0.4
0.4
0.3
0.3
0.2
0.2
0.1
0.1
0
0
Prior probability
Posterior (modified) probability
Fig. 20.29 Modification of geological risk by introducing CSEM data in prospect evaluation. By using performance tracking the
prediction strength for the CSEM data can be quantified and used in the evaluation process. See text for explanation
20 Interpretation of Marine CSEM and Marine MT Data for Hydrocarbon Prospecting
543
for the new data is needed. In this way the value of the
new information can be quantified. When evaluating
prediction strength, the strong and weak sides of the
CSEM technique must be taken into consideration. On
the strong side is the ability to measure general resistivity variations, areal distribution of the resistivity
anomaly, and in some case also the thickness and
volume of the measured objects. The ability to map
these parameters is strongly dependent on acquisition
geometry and complexity of the subsurface. The
method’s weak sides are for example vertical resolution, depth conversion and strong attenuation with
depth.
Another important step in evaluating the prediction
strength of CSEM data is to perform a thorough sensitivity study including detailed forward modelling. Further, statistical performance data for similar CSEM
targets can be included and used in a risk modification
procedure.
However, the lack of significant performance data
is a challenge when using a relatively new data type
like CSEM data. In the ideal case all relevant subsurface scenarios that can explain the CSEM observations
should be included, also those not involving
hydrocarbons.
However, the performance data base can be
simplified, and the measured CSEM cases can be
divided into two categories: Right prediction or
Wrong prediction. Now, in a case were the geological
chance of success for a prospect is decided, it can
be modified by including CSEM data. If the Right/
Wrong ratio from the performance data base is
high the impact on the geological chance of success
will also be high. Figure 20.29 can be used to illustrate
the effect adding new information from CSEM
data will have on a prospect’s geological chance of
success.
If it is decided that the geological chance of success
for your prospect is 20%, it will plot at 0.2 on the
horizontal axis. Your performance data base for the
CSEM data have told you, that for the setting your
prospect is in, the prediction strength is very good with
a Right/Wrong ratio as high as 0.8. The 0.8-line in
Fig. 20.29 is green line number three up from the 0.5
black line. Then, if the acquired CSEM data are positive, the modified chance of success in this example
would increase from 0.2 to 0.5. If the CSEM data are
negative the modified probability should be decreased
to approximately 0.06.
CSEM data can of course also be used without
having a performance data base available, but as experience with the method builds up, this is one way to
include the new knowledge in the prospect risking
process. In many cases, for many companies, a statistical performance database is not available. In such
1
1
0.9
0.9
0.8
0.8
0.7
0.7
0.6
0.6
0.5
0.5
0.4
0.4
0.3
0.3
0.2
0.2
0.1
0.1
0
0
Prior probability
Posterior (modified) probability
Fig. 20.29 Modification of geological risk by introducing CSEM data in prospect evaluation. By using performance tracking the
prediction strength for the CSEM data can be quantified and used in the evaluation process. See text for explanation
20 Interpretation of Marine CSEM and Marine MT Data for Hydrocarbon Prospecting
543