

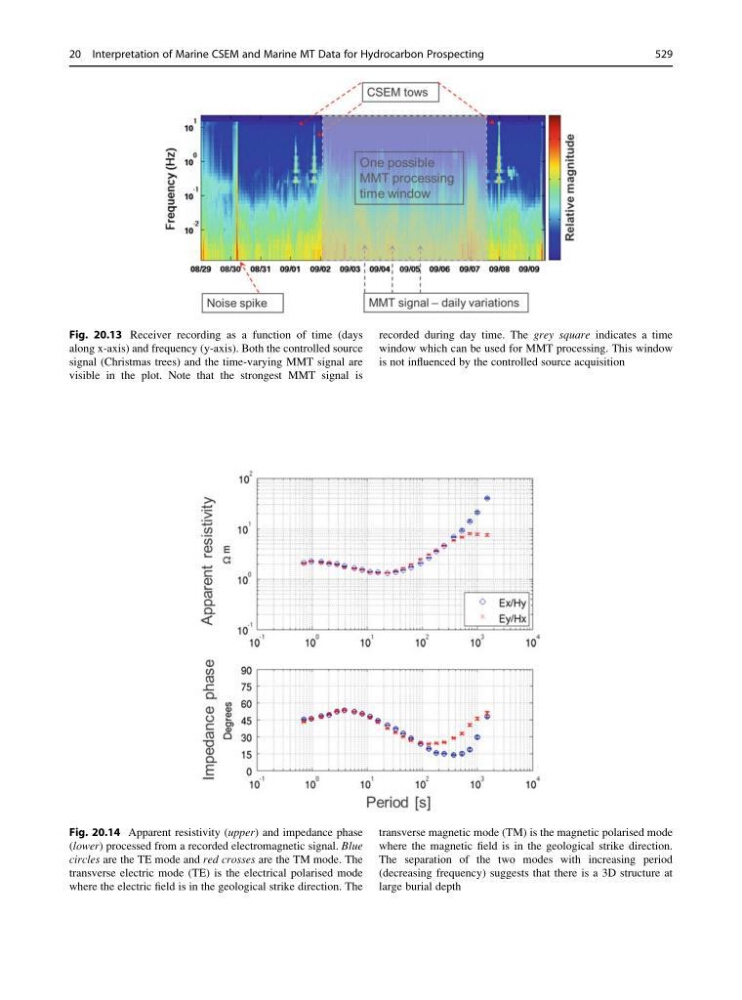
Fig. 20.13 Receiver recording as a function of time (days
along x-axis) and frequency (y-axis). Both the controlled source
signal (Christmas trees) and the time-varying MMT signal are
visible in the plot. Note that the strongest MMT signal is
recorded during day time. The grey square indicates a time
window which can be used for MMT processing. This window
is not influenced by the controlled source acquisition
Fig. 20.14 Apparent resistivity (upper) and impedance phase
(lower) processed from a recorded electromagnetic signal. Blue
circles are the TE mode and red crosses are the TM mode. The
transverse electric mode (TE) is the electrical polarised mode
where the electric field is in the geological strike direction. The
transverse magnetic mode (TM) is the magnetic polarised mode
where the magnetic field is in the geological strike direction.
The separation of the two modes with increasing period
(decreasing frequency) suggests that there is a 3D structure at
large burial depth
20 Interpretation of Marine CSEM and Marine MT Data for Hydrocarbon Prospecting
529
along x-axis) and frequency (y-axis). Both the controlled source
signal (Christmas trees) and the time-varying MMT signal are
visible in the plot. Note that the strongest MMT signal is
recorded during day time. The grey square indicates a time
window which can be used for MMT processing. This window
is not influenced by the controlled source acquisition
Fig. 20.14 Apparent resistivity (upper) and impedance phase
(lower) processed from a recorded electromagnetic signal. Blue
circles are the TE mode and red crosses are the TM mode. The
transverse electric mode (TE) is the electrical polarised mode
where the electric field is in the geological strike direction. The
transverse magnetic mode (TM) is the magnetic polarised mode
where the magnetic field is in the geological strike direction.
The separation of the two modes with increasing period
(decreasing frequency) suggests that there is a 3D structure at
large burial depth
20 Interpretation of Marine CSEM and Marine MT Data for Hydrocarbon Prospecting
529