

Hence, the anisotropy in the thin hydrocarbon layer is
equal to one. Based on this Earth resistivity model,
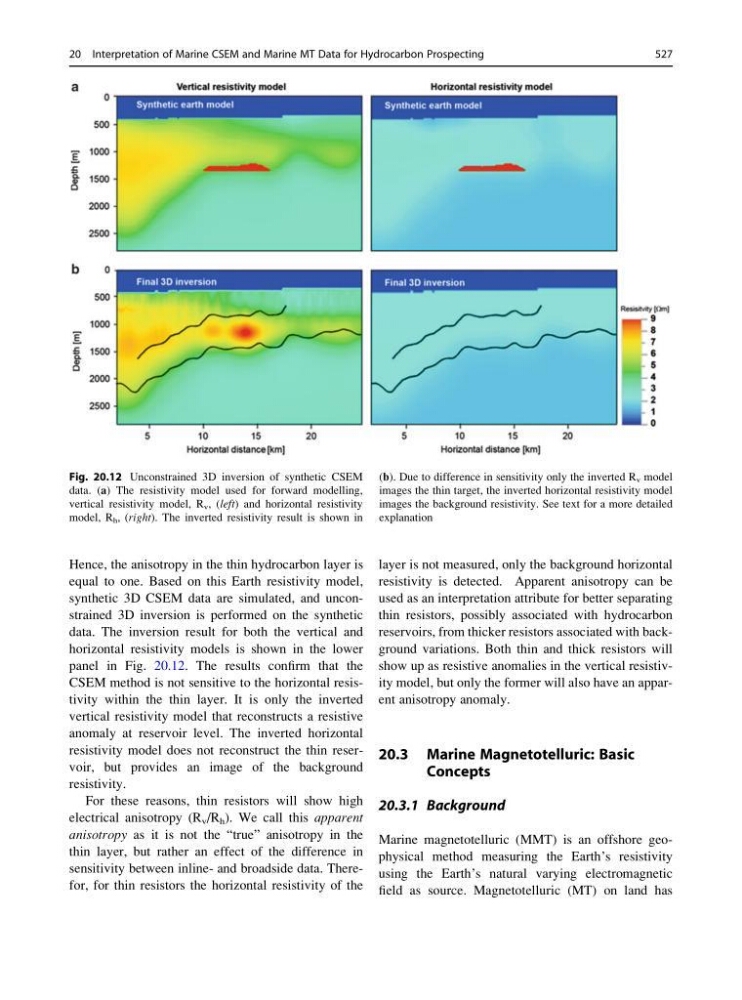
synthetic 3D CSEM data are simulated, and unconstrained 3D inversion is performed on the synthetic
data. The inversion result for both the vertical and
horizontal resistivity models is shown in the lower
panel in Fig. 20.12. The results confirm that the
CSEM method is not sensitive to the horizontal resistivity within the thin layer. It is only the inverted
vertical resistivity model that reconstructs a resistive
anomaly at reservoir level. The inverted horizontal
resistivity model does not reconstruct the thin reservoir, but provides an image of the background
resistivity.
For these reasons, thin resistors will show high
electrical anisotropy (R v /R h ). We call this apparent
anisotropy as it is not the “true” anisotropy in the
thin layer, but rather an effect of the difference in
sensitivity between inline- and broadside data. Therefor, for thin resistors the horizontal resistivity of the
layer is not measured, only the background horizontal
resistivity is detected. Apparent anisotropy can be
used as an interpretation attribute for better separating
thin resistors, possibly associated with hydrocarbon
reservoirs, from thicker resistors associated with background variations. Both thin and thick resistors will
show up as resistive anomalies in the vertical resistivity model, but only the former will also have an apparent anisotropy anomaly.
20.3 Marine Magnetotelluric: Basic
Concepts
20.3.1 Background
Marine magnetotelluric (MMT) is an offshore geophysical method measuring the Earth’s resistivity
using the Earth’s natural varying electromagnetic
field as source. Magnetotelluric (MT) on land has
Fig. 20.12 Unconstrained 3D inversion of synthetic CSEM
data. (a) The resistivity model used for forward modelling,
vertical resistivity model, R v , (left) and horizontal resistivity
model, R h , (right). The inverted resistivity result is shown in
(b). Due to difference in sensitivity only the inverted R v model
images the thin target, the inverted horizontal resistivity model
images the background resistivity. See text for a more detailed
explanation
20 Interpretation of Marine CSEM and Marine MT Data for Hydrocarbon Prospecting
527
equal to one. Based on this Earth resistivity model,
synthetic 3D CSEM data are simulated, and unconstrained 3D inversion is performed on the synthetic
data. The inversion result for both the vertical and
horizontal resistivity models is shown in the lower
panel in Fig. 20.12. The results confirm that the
CSEM method is not sensitive to the horizontal resistivity within the thin layer. It is only the inverted
vertical resistivity model that reconstructs a resistive
anomaly at reservoir level. The inverted horizontal
resistivity model does not reconstruct the thin reservoir, but provides an image of the background
resistivity.
For these reasons, thin resistors will show high
electrical anisotropy (R v /R h ). We call this apparent
anisotropy as it is not the “true” anisotropy in the
thin layer, but rather an effect of the difference in
sensitivity between inline- and broadside data. Therefor, for thin resistors the horizontal resistivity of the
layer is not measured, only the background horizontal
resistivity is detected. Apparent anisotropy can be
used as an interpretation attribute for better separating
thin resistors, possibly associated with hydrocarbon
reservoirs, from thicker resistors associated with background variations. Both thin and thick resistors will
show up as resistive anomalies in the vertical resistivity model, but only the former will also have an apparent anisotropy anomaly.
20.3 Marine Magnetotelluric: Basic
Concepts
20.3.1 Background
Marine magnetotelluric (MMT) is an offshore geophysical method measuring the Earth’s resistivity
using the Earth’s natural varying electromagnetic
field as source. Magnetotelluric (MT) on land has
Fig. 20.12 Unconstrained 3D inversion of synthetic CSEM
data. (a) The resistivity model used for forward modelling,
vertical resistivity model, R v , (left) and horizontal resistivity
model, R h , (right). The inverted resistivity result is shown in
(b). Due to difference in sensitivity only the inverted R v model
images the thin target, the inverted horizontal resistivity model
images the background resistivity. See text for a more detailed
explanation
20 Interpretation of Marine CSEM and Marine MT Data for Hydrocarbon Prospecting
527