

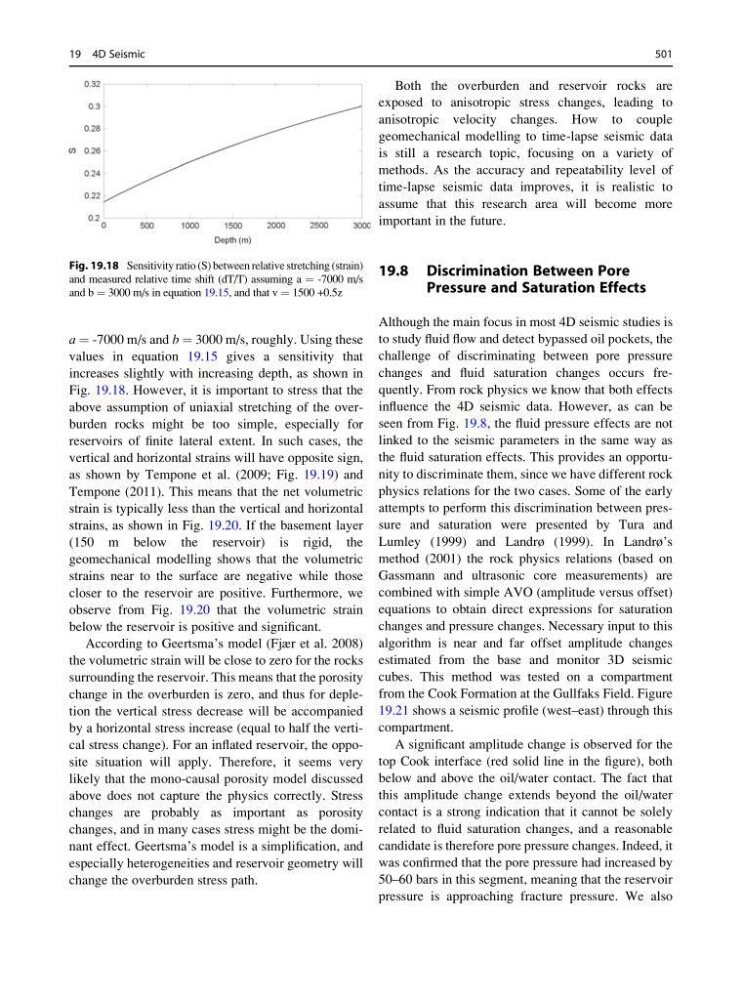
a ¼ -7000 m/s and b ¼ 3000 m/s, roughly. Using these
values in equation 19.15 gives a sensitivity that
increases slightly with increasing depth, as shown in
Fig. 19.18. However, it is important to stress that the
above assumption of uniaxial stretching of the overburden rocks might be too simple, especially for
reservoirs of finite lateral extent. In such cases, the
vertical and horizontal strains will have opposite sign,
as shown by Tempone et al. (2009; Fig. 19.19) and
Tempone (2011). This means that the net volumetric
strain is typically less than the vertical and horizontal
strains, as shown in Fig. 19.20. If the basement layer
(150 m below the reservoir) is rigid, the
geomechanical modelling shows that the volumetric
strains near to the surface are negative while those
closer to the reservoir are positive. Furthermore, we
observe from Fig. 19.20 that the volumetric strain
below the reservoir is positive and significant.
According to Geertsma’s model (Fjær et al. 2008)
the volumetric strain will be close to zero for the rocks
surrounding the reservoir. This means that the porosity
change in the overburden is zero, and thus for depletion the vertical stress decrease will be accompanied
by a horizontal stress increase (equal to half the vertical stress change). For an inflated reservoir, the opposite situation will apply. Therefore, it seems very
likely that the mono-causal porosity model discussed
above does not capture the physics correctly. Stress
changes are probably as important as porosity
changes, and in many cases stress might be the dominant effect. Geertsma’s model is a simplification, and
especially heterogeneities and reservoir geometry will
change the overburden stress path.
Both the overburden and reservoir rocks are
exposed to anisotropic stress changes, leading to
anisotropic velocity changes. How to couple
geomechanical modelling to time-lapse seismic data
is still a research topic, focusing on a variety of
methods. As the accuracy and repeatability level of
time-lapse seismic data improves, it is realistic to
assume that this research area will become more
important in the future.
19.8 Discrimination Between Pore
Pressure and Saturation Effects
Although the main focus in most 4D seismic studies is
to study fluid flow and detect bypassed oil pockets, the
challenge of discriminating between pore pressure
changes and fluid saturation changes occurs frequently. From rock physics we know that both effects
influence the 4D seismic data. However, as can be
seen from Fig. 19.8, the fluid pressure effects are not
linked to the seismic parameters in the same way as
the fluid saturation effects. This provides an opportunity to discriminate them, since we have different rock
physics relations for the two cases. Some of the early
attempts to perform this discrimination between pressure and saturation were presented by Tura and
Lumley (1999) and Landrø (1999). In Landrø’s
method (2001) the rock physics relations (based on
Gassmann and ultrasonic core measurements) are
combined with simple AVO (amplitude versus offset)
equations to obtain direct expressions for saturation
changes and pressure changes. Necessary input to this
algorithm is near and far offset amplitude changes
estimated from the base and monitor 3D seismic
cubes. This method was tested on a compartment
from the Cook Formation at the Gullfaks Field. Figure
19.21 shows a seismic profile (west–east) through this
compartment.
A significant amplitude change is observed for the
top Cook interface (red solid line in the figure), both
below and above the oil/water contact. The fact that
this amplitude change extends beyond the oil/water
contact is a strong indication that it cannot be solely
related to fluid saturation changes, and a reasonable
candidate is therefore pore pressure changes. Indeed, it
was confirmed that the pore pressure had increased by
50–60 bars in this segment, meaning that the reservoir
pressure is approaching fracture pressure. We also
Fig. 19.18 Sensitivity ratio (S) between relative stretching (strain)
and measured relative time shift (dT/T) assuming a ¼ -7000 m/s
and b ¼ 3000 m/s in equation 19.15, and that v ¼ 1500 +0.5z
19 4D Seismic
501
values in equation 19.15 gives a sensitivity that
increases slightly with increasing depth, as shown in
Fig. 19.18. However, it is important to stress that the
above assumption of uniaxial stretching of the overburden rocks might be too simple, especially for
reservoirs of finite lateral extent. In such cases, the
vertical and horizontal strains will have opposite sign,
as shown by Tempone et al. (2009; Fig. 19.19) and
Tempone (2011). This means that the net volumetric
strain is typically less than the vertical and horizontal
strains, as shown in Fig. 19.20. If the basement layer
(150 m below the reservoir) is rigid, the
geomechanical modelling shows that the volumetric
strains near to the surface are negative while those
closer to the reservoir are positive. Furthermore, we
observe from Fig. 19.20 that the volumetric strain
below the reservoir is positive and significant.
According to Geertsma’s model (Fjær et al. 2008)
the volumetric strain will be close to zero for the rocks
surrounding the reservoir. This means that the porosity
change in the overburden is zero, and thus for depletion the vertical stress decrease will be accompanied
by a horizontal stress increase (equal to half the vertical stress change). For an inflated reservoir, the opposite situation will apply. Therefore, it seems very
likely that the mono-causal porosity model discussed
above does not capture the physics correctly. Stress
changes are probably as important as porosity
changes, and in many cases stress might be the dominant effect. Geertsma’s model is a simplification, and
especially heterogeneities and reservoir geometry will
change the overburden stress path.
Both the overburden and reservoir rocks are
exposed to anisotropic stress changes, leading to
anisotropic velocity changes. How to couple
geomechanical modelling to time-lapse seismic data
is still a research topic, focusing on a variety of
methods. As the accuracy and repeatability level of
time-lapse seismic data improves, it is realistic to
assume that this research area will become more
important in the future.
19.8 Discrimination Between Pore
Pressure and Saturation Effects
Although the main focus in most 4D seismic studies is
to study fluid flow and detect bypassed oil pockets, the
challenge of discriminating between pore pressure
changes and fluid saturation changes occurs frequently. From rock physics we know that both effects
influence the 4D seismic data. However, as can be
seen from Fig. 19.8, the fluid pressure effects are not
linked to the seismic parameters in the same way as
the fluid saturation effects. This provides an opportunity to discriminate them, since we have different rock
physics relations for the two cases. Some of the early
attempts to perform this discrimination between pressure and saturation were presented by Tura and
Lumley (1999) and Landrø (1999). In Landrø’s
method (2001) the rock physics relations (based on
Gassmann and ultrasonic core measurements) are
combined with simple AVO (amplitude versus offset)
equations to obtain direct expressions for saturation
changes and pressure changes. Necessary input to this
algorithm is near and far offset amplitude changes
estimated from the base and monitor 3D seismic
cubes. This method was tested on a compartment
from the Cook Formation at the Gullfaks Field. Figure
19.21 shows a seismic profile (west–east) through this
compartment.
A significant amplitude change is observed for the
top Cook interface (red solid line in the figure), both
below and above the oil/water contact. The fact that
this amplitude change extends beyond the oil/water
contact is a strong indication that it cannot be solely
related to fluid saturation changes, and a reasonable
candidate is therefore pore pressure changes. Indeed, it
was confirmed that the pore pressure had increased by
50–60 bars in this segment, meaning that the reservoir
pressure is approaching fracture pressure. We also
Fig. 19.18 Sensitivity ratio (S) between relative stretching (strain)
and measured relative time shift (dT/T) assuming a ¼ -7000 m/s
and b ¼ 3000 m/s in equation 19.15, and that v ¼ 1500 +0.5z
19 4D Seismic
501