

341
375 400 425 450 475 500 525 550 575 600 625 650
0
1 km
N
670
Intra-Ness Fm.
Amundsen Fm.
Fault
2692
2596
2348
2100
1852
500
550
600
650
700
750
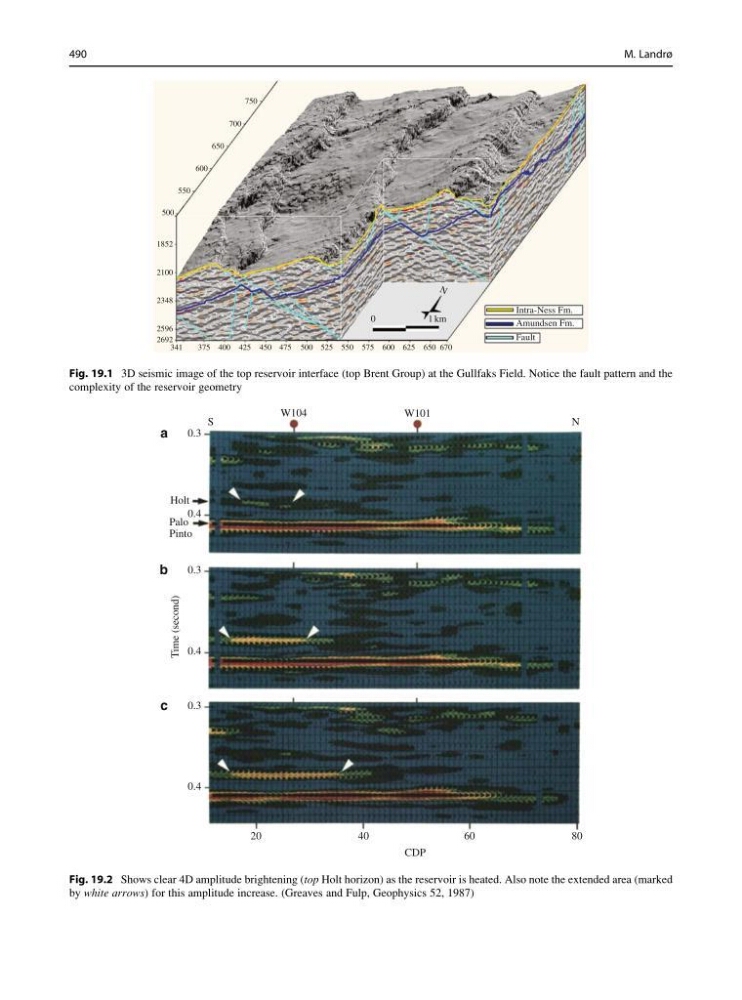
Fig. 19.1 3D seismic image of the top reservoir interface (top Brent Group) at the Gullfaks Field. Notice the fault pattern and the
complexity of the reservoir geometry
S
0.3
Holt
Palo
Pinto
a
b
Time (second)
c
0.4
0.4
0.4
20
40
60
CDP
80
0.3
0.3
N
W104
W101
Fig. 19.2 Shows clear 4D amplitude brightening (top Holt horizon) as the reservoir is heated. Also note the extended area (marked
by white arrows) for this amplitude increase. (Greaves and Fulp, Geophysics 52, 1987)
490
M. Landrø
375 400 425 450 475 500 525 550 575 600 625 650
0
1 km
N
670
Intra-Ness Fm.
Amundsen Fm.
Fault
2692
2596
2348
2100
1852
500
550
600
650
700
750
Fig. 19.1 3D seismic image of the top reservoir interface (top Brent Group) at the Gullfaks Field. Notice the fault pattern and the
complexity of the reservoir geometry
S
0.3
Holt
Palo
Pinto
a
b
Time (second)
c
0.4
0.4
0.4
20
40
60
CDP
80
0.3
0.3
N
W104
W101
Fig. 19.2 Shows clear 4D amplitude brightening (top Holt horizon) as the reservoir is heated. Also note the extended area (marked
by white arrows) for this amplitude increase. (Greaves and Fulp, Geophysics 52, 1987)
490
M. Landrø