

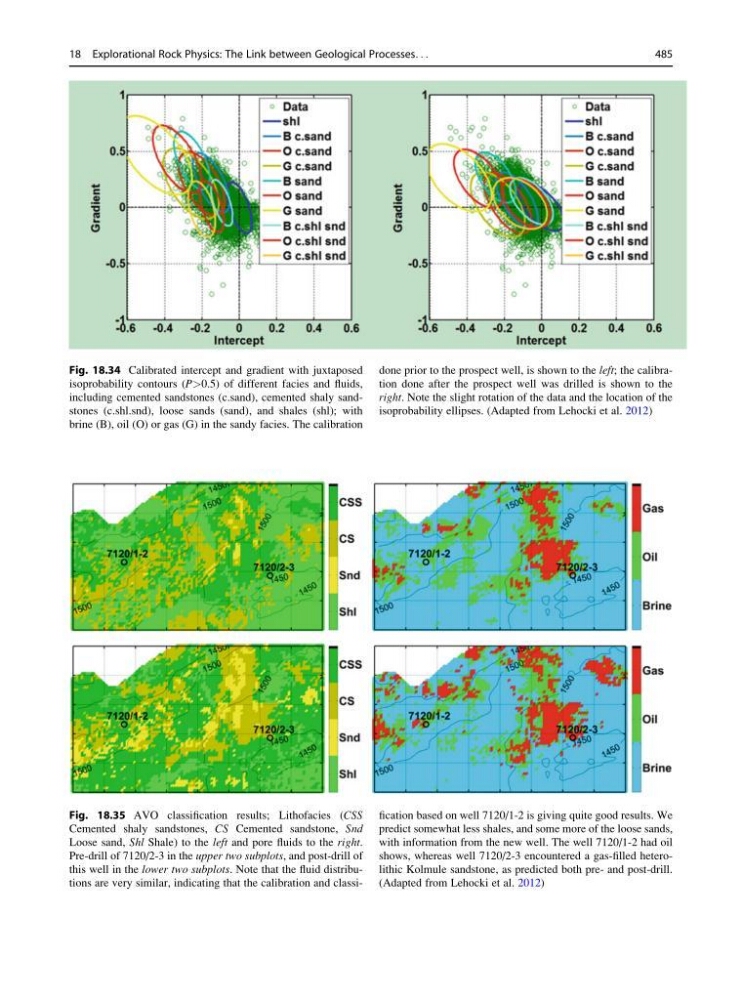
Fig. 18.34 Calibrated intercept and gradient with juxtaposed
isoprobability contours (P>0.5) of different facies and fluids,
including cemented sandstones (c.sand), cemented shaly sandstones (c.shl.snd), loose sands (sand), and shales (shl); with
brine (B), oil (O) or gas (G) in the sandy facies. The calibration
done prior to the prospect well, is shown to the left; the calibration done after the prospect well was drilled is shown to the
right. Note the slight rotation of the data and the location of the
isoprobability ellipses. (Adapted from Lehocki et al. 2012)
Fig. 18.35 AVO classification results; Lithofacies (CSS
Cemented shaly sandstones, CS Cemented sandstone, Snd
Loose sand, Shl Shale) to the left and pore fluids to the right.
Pre-drill of 7120/2-3 in the upper two subplots, and post-drill of
this well in the lower two subplots. Note that the fluid distributions are very similar, indicating that the calibration and classification based on well 7120/1-2 is giving quite good results. We
predict somewhat less shales, and some more of the loose sands,
with information from the new well. The well 7120/1-2 had oil
shows, whereas well 7120/2-3 encountered a gas-filled heterolithic Kolmule sandstone, as predicted both pre- and post-drill.
(Adapted from Lehocki et al. 2012)
18 Explorational Rock Physics: The Link between Geological Processes. . .
485
isoprobability contours (P>0.5) of different facies and fluids,
including cemented sandstones (c.sand), cemented shaly sandstones (c.shl.snd), loose sands (sand), and shales (shl); with
brine (B), oil (O) or gas (G) in the sandy facies. The calibration
done prior to the prospect well, is shown to the left; the calibration done after the prospect well was drilled is shown to the
right. Note the slight rotation of the data and the location of the
isoprobability ellipses. (Adapted from Lehocki et al. 2012)
Fig. 18.35 AVO classification results; Lithofacies (CSS
Cemented shaly sandstones, CS Cemented sandstone, Snd
Loose sand, Shl Shale) to the left and pore fluids to the right.
Pre-drill of 7120/2-3 in the upper two subplots, and post-drill of
this well in the lower two subplots. Note that the fluid distributions are very similar, indicating that the calibration and classification based on well 7120/1-2 is giving quite good results. We
predict somewhat less shales, and some more of the loose sands,
with information from the new well. The well 7120/1-2 had oil
shows, whereas well 7120/2-3 encountered a gas-filled heterolithic Kolmule sandstone, as predicted both pre- and post-drill.
(Adapted from Lehocki et al. 2012)
18 Explorational Rock Physics: The Link between Geological Processes. . .
485