

when analysing many datasets on one common canvas, or it can allow travel through time in a 4D
visualisation process comparing one survey to another.
Advance visualisation techniques allow us to interactively explore regional datasets, integrate live well
information into a reservoir model and understand
reservoir dynamics in association with a 4D predictive
model (Fig. 17.36). 3D visualisation technique is also
used to estimate thickness, continuity and lateral
extend of a reservoir and its relationship with horizons
and faults to see the finest reservoir details.
Visualising combinations of complex seismic
attributes like amplitude, continuity and AVO (Amplitude Versus Offset) provide a far more accurate
0.1
Ultrasonic
Sonic
logging
Sonic
imaging
Crosswell
seismic
VSP
3D seismic
2D seismic
Resolution, m
0
0.1
1.0
10
100
1.0
10
100
1000
Range, m
Fig. 17.35 Plot of range versus resolution of various geophysical techniques. (Courtesy: Schlumberger Oilfield Glossary)
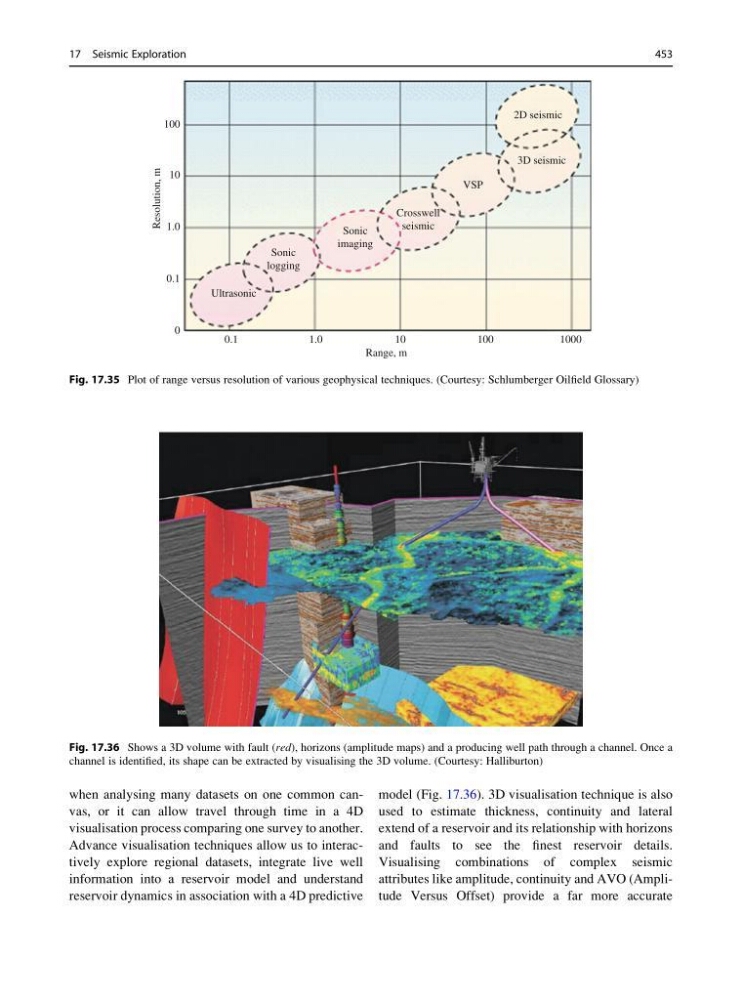
Fig. 17.36 Shows a 3D volume with fault (red), horizons (amplitude maps) and a producing well path through a channel. Once a
channel is identified, its shape can be extracted by visualising the 3D volume. (Courtesy: Halliburton)
17 Seismic Exploration
453
visualisation process comparing one survey to another.
Advance visualisation techniques allow us to interactively explore regional datasets, integrate live well
information into a reservoir model and understand
reservoir dynamics in association with a 4D predictive
model (Fig. 17.36). 3D visualisation technique is also
used to estimate thickness, continuity and lateral
extend of a reservoir and its relationship with horizons
and faults to see the finest reservoir details.
Visualising combinations of complex seismic
attributes like amplitude, continuity and AVO (Amplitude Versus Offset) provide a far more accurate
0.1
Ultrasonic
Sonic
logging
Sonic
imaging
Crosswell
seismic
VSP
3D seismic
2D seismic
Resolution, m
0
0.1
1.0
10
100
1.0
10
100
1000
Range, m
Fig. 17.35 Plot of range versus resolution of various geophysical techniques. (Courtesy: Schlumberger Oilfield Glossary)
Fig. 17.36 Shows a 3D volume with fault (red), horizons (amplitude maps) and a producing well path through a channel. Once a
channel is identified, its shape can be extracted by visualising the 3D volume. (Courtesy: Halliburton)
17 Seismic Exploration
453