

As an example, if we introduce the centre frequency f c of the energy pulse (disturbance) we obtain
the following simple relationship between the dominant wavelength (λ), the wave velocity (V) and the
centre frequency (f c ):
λ ffi
V
f c
(17.8)
The typical values for the dominant wavelength are
then (a) λ ¼ 40 m at shallow depth (upper 300–500 m
depth), where V ¼ 2; 000 m=s and f ¼ 50 Hz, (b) λ ¼
100 m at intermediate depths (about 3,500 m), where
V ¼ 3; 500 m=s and f ¼ 35 Hz and (c) λ ¼ 250 m at
depths of about 5,000 m), where V ¼ 5; 000 m=s and
f ¼ 20 Hz. For smaller thicknesses than λ/4 we rely on
the amplitude to judge the bed thickness. For
thicknesses larger than λ/4 we can use the waveform.
17.7 Seismic Interpretation
Seismic data are studied by geoscientists to interpret
the composition, fluid content, extent and geometry of
rocks in the subsurface. Interpretation of seismic data
will be based on an integrated use of seismic inlines,
crosslines, time slices and horizon attributes (Dalley
et al. 1989, Hesthammer et al. 2001). The seismic
sections or images represent slices through the geological model, which can be input to advanced
workstations where the actual interpretation can take
place. Seismic data can be used in many ways such as
regional mapping, prospect mapping, reservoir delineation, seismic modelling, direct hydrocarbon detection and the monitoring of producing reservoirs. Based
on the seismic interpretation one will decide if an area
is a possible prospect for hydrocarbon (oil or gas). If
the answer is positive, an exploration well will be
drilled. The ultimate goal will be the drilling of production wells if the target area proves to be a commercial reservoir. Seismic data contain a mixture of signal
and noise. It is therefore crucial to understand the
signature of the noise, whether it is systematic or
random, dipping or flat-lying, planar or non-planar. It
is also necessary to investigate the origin of the noise.
The challenge of seismic interpretation is then to fully
utilise all the information contained in the seismic
data. Systematic noise can be related to acquisition
procedures,
processing
artefacts,
water-layer
multiples, faults, complex stratigraphy and shallow
4.0
3.0
2.0
Time, sec
1.0
0
0–10 Hz
10–20 Hz
20–30 Hz
30–40 Hz
40–50 Hz
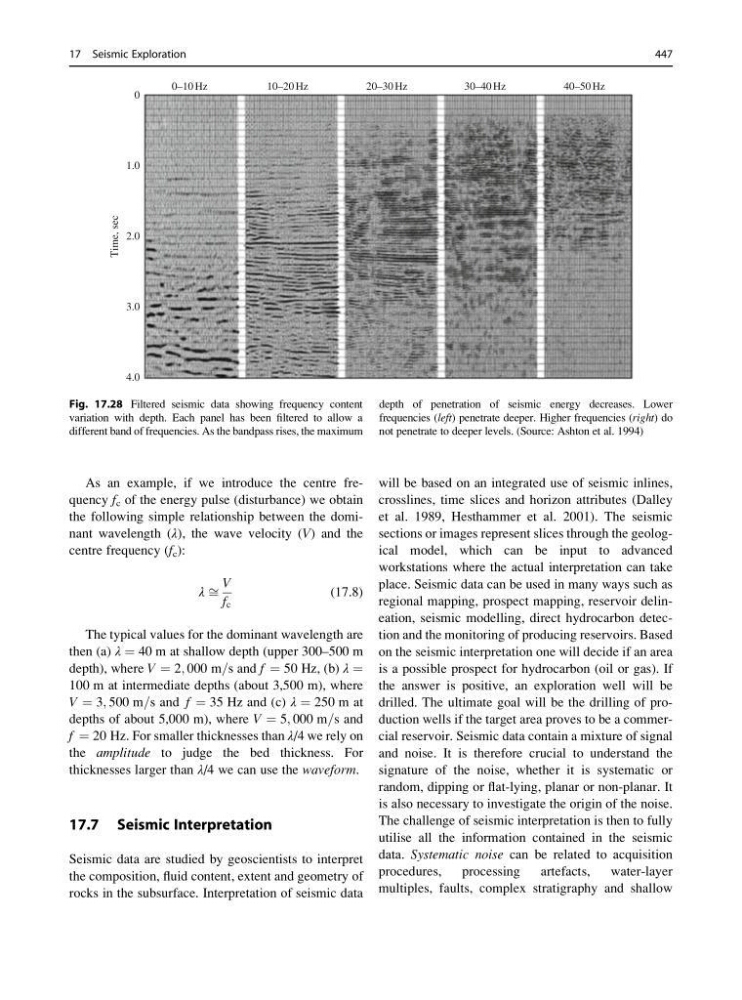
Fig. 17.28 Filtered seismic data showing frequency content
variation with depth. Each panel has been filtered to allow a
different band of frequencies. As the bandpass rises, the maximum
depth of penetration of seismic energy decreases. Lower
frequencies (left) penetrate deeper. Higher frequencies (right) do
not penetrate to deeper levels. (Source: Ashton et al. 1994)
17 Seismic Exploration
447
the following simple relationship between the dominant wavelength (λ), the wave velocity (V) and the
centre frequency (f c ):
λ ffi
V
f c
(17.8)
The typical values for the dominant wavelength are
then (a) λ ¼ 40 m at shallow depth (upper 300–500 m
depth), where V ¼ 2; 000 m=s and f ¼ 50 Hz, (b) λ ¼
100 m at intermediate depths (about 3,500 m), where
V ¼ 3; 500 m=s and f ¼ 35 Hz and (c) λ ¼ 250 m at
depths of about 5,000 m), where V ¼ 5; 000 m=s and
f ¼ 20 Hz. For smaller thicknesses than λ/4 we rely on
the amplitude to judge the bed thickness. For
thicknesses larger than λ/4 we can use the waveform.
17.7 Seismic Interpretation
Seismic data are studied by geoscientists to interpret
the composition, fluid content, extent and geometry of
rocks in the subsurface. Interpretation of seismic data
will be based on an integrated use of seismic inlines,
crosslines, time slices and horizon attributes (Dalley
et al. 1989, Hesthammer et al. 2001). The seismic
sections or images represent slices through the geological model, which can be input to advanced
workstations where the actual interpretation can take
place. Seismic data can be used in many ways such as
regional mapping, prospect mapping, reservoir delineation, seismic modelling, direct hydrocarbon detection and the monitoring of producing reservoirs. Based
on the seismic interpretation one will decide if an area
is a possible prospect for hydrocarbon (oil or gas). If
the answer is positive, an exploration well will be
drilled. The ultimate goal will be the drilling of production wells if the target area proves to be a commercial reservoir. Seismic data contain a mixture of signal
and noise. It is therefore crucial to understand the
signature of the noise, whether it is systematic or
random, dipping or flat-lying, planar or non-planar. It
is also necessary to investigate the origin of the noise.
The challenge of seismic interpretation is then to fully
utilise all the information contained in the seismic
data. Systematic noise can be related to acquisition
procedures,
processing
artefacts,
water-layer
multiples, faults, complex stratigraphy and shallow
4.0
3.0
2.0
Time, sec
1.0
0
0–10 Hz
10–20 Hz
20–30 Hz
30–40 Hz
40–50 Hz
Fig. 17.28 Filtered seismic data showing frequency content
variation with depth. Each panel has been filtered to allow a
different band of frequencies. As the bandpass rises, the maximum
depth of penetration of seismic energy decreases. Lower
frequencies (left) penetrate deeper. Higher frequencies (right) do
not penetrate to deeper levels. (Source: Ashton et al. 1994)
17 Seismic Exploration
447