

1,000 ohm-m are uncommon in most permeable
formations but are observed in impermeable, low
porosity formations such as evaporites. A few low
porosity hydrocarbon-bearing formations with almost
no formation water can have resistivities as high as
20,000 ohm-m. Because resistivities cannot be read
accurately over the entire measurement range when
displayed on a linear scale, all resistivity logs are
presented on logarithmic grids (Fig. 16.32).
Resistivity and Conductivity Tools
To measure electrical rock properties, there are two
main types of logging tool available: one measures
resistivity (resistivity tools) and the other measures
conductivity (induction tools). Formation resistivities
are measured either by passing a known current
through the formation and measuring the electrical
potential (electrode or galvanic devices) or by inducing a current distribution in the formation and measuring its magnitude (induction devices). An electric
current can pass through a formation because it
contains water with enough dissolved ions to be conductive. With a few rare exceptions, such as clay
minerals, metallic sulphides and graphite, rock matrix
is a good electrical conductor. The resistivity and
conductivity tools have many varieties that are commonly used to investigate resistivity in different zones
around the borehole (Table 16.8).
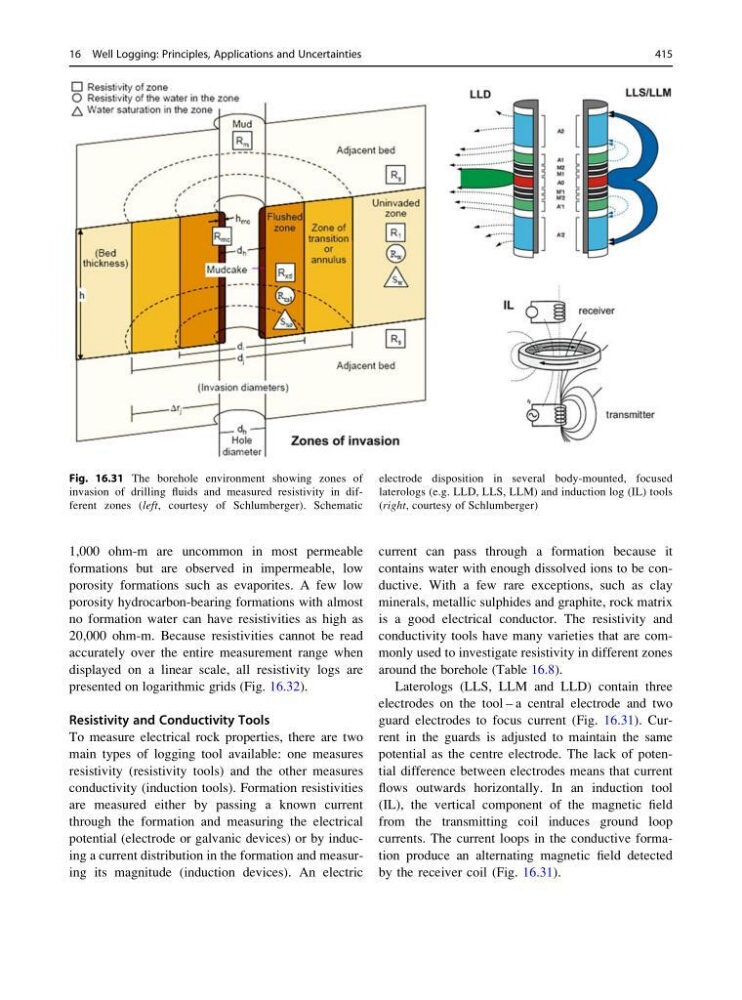
Laterologs (LLS, LLM and LLD) contain three
electrodes on the tool – a central electrode and two
guard electrodes to focus current (Fig. 16.31). Current in the guards is adjusted to maintain the same
potential as the centre electrode. The lack of potential difference between electrodes means that current
flows outwards horizontally. In an induction tool
(IL), the vertical component of the magnetic field
from the transmitting coil induces ground loop
currents. The current loops in the conductive formation produce an alternating magnetic field detected
by the receiver coil (Fig. 16.31).
Fig. 16.31 The borehole environment showing zones of
invasion of drilling fluids and measured resistivity in different zones (left, courtesy of Schlumberger). Schematic
electrode disposition in several body-mounted, focused
laterologs (e.g. LLD, LLS, LLM) and induction log (IL) tools
(right, courtesy of Schlumberger)
16 Well Logging: Principles, Applications and Uncertainties
415
formations but are observed in impermeable, low
porosity formations such as evaporites. A few low
porosity hydrocarbon-bearing formations with almost
no formation water can have resistivities as high as
20,000 ohm-m. Because resistivities cannot be read
accurately over the entire measurement range when
displayed on a linear scale, all resistivity logs are
presented on logarithmic grids (Fig. 16.32).
Resistivity and Conductivity Tools
To measure electrical rock properties, there are two
main types of logging tool available: one measures
resistivity (resistivity tools) and the other measures
conductivity (induction tools). Formation resistivities
are measured either by passing a known current
through the formation and measuring the electrical
potential (electrode or galvanic devices) or by inducing a current distribution in the formation and measuring its magnitude (induction devices). An electric
current can pass through a formation because it
contains water with enough dissolved ions to be conductive. With a few rare exceptions, such as clay
minerals, metallic sulphides and graphite, rock matrix
is a good electrical conductor. The resistivity and
conductivity tools have many varieties that are commonly used to investigate resistivity in different zones
around the borehole (Table 16.8).
Laterologs (LLS, LLM and LLD) contain three
electrodes on the tool – a central electrode and two
guard electrodes to focus current (Fig. 16.31). Current in the guards is adjusted to maintain the same
potential as the centre electrode. The lack of potential difference between electrodes means that current
flows outwards horizontally. In an induction tool
(IL), the vertical component of the magnetic field
from the transmitting coil induces ground loop
currents. The current loops in the conductive formation produce an alternating magnetic field detected
by the receiver coil (Fig. 16.31).
Fig. 16.31 The borehole environment showing zones of
invasion of drilling fluids and measured resistivity in different zones (left, courtesy of Schlumberger). Schematic
electrode disposition in several body-mounted, focused
laterologs (e.g. LLD, LLS, LLM) and induction log (IL) tools
(right, courtesy of Schlumberger)
16 Well Logging: Principles, Applications and Uncertainties
415