

respectively, while the very high neutron porosity of
gypsum is caused by hydrogen in its water of
crystallisation.
Coal Identification
In combination with density and neutron logs, PEF can
be useful to identify coal (Fig. 16.29). Clastic
successions containing coals were commonly developed in deltaic environments with shales, siltstones
and sandstones, as well as occasional ironstones (typically siderite). The clay mineralogy of the finergrained rocks is quite variable and can show elevated
contents of kaolinite, particularly in palaeosols. The
PEF response of coals varies according to their rank
(0.20 for lignite, 0.17 for bitumin and 0.16 for
anthracite).
16.5.6.3 Uncertainties of Photoelectric/
Litho-density Log
Most drilling fluids have very low PEF values. When
this information is combined with the fact that the lithodensity tool is pad-mounted and pressed against the
borehole wall, one can see that most types of drilling
mud will not have a great effect on the PEF measurements. The exception is barite which has a huge PEF
value and will swamp all other log responses if the tool
sees barite drilling mud. Therefore, in practice the PEF
log is not used in holes drilled with barite mud.
16.5.7 Resistivity and Conductivity Logs
16.5.7.1 Generalities and Basic Principles
Resistivity is a fundamental material property that
represents how strongly a material opposes the flow
of electric current (Fig. 16.30). Most rock-forming
minerals are essentially insulators, while their
enclosed fluids are conductors. Almost all conduction
takes place through the liquid phase, and the resistance
therefore depends primarily on the pore fluid and its
salt content. Hydrocarbon fluids are an exception,
because they are almost infinitely resistive. When a
formation is porous and contains salty water, the overall resistivity will be low. When the formation
contains hydrocarbon, or contains very low porosity,
its resistivity will be high. Resistivity is also a function
of the amount of porewater relative to rock volume
(hence porosity) and the distribution of pores in the
rock (permeability).
The resistivity log must run in holes containing
electrically conductive mud. Each of the electric log
measurements depends on the degree to which drilling
mud invades the formation, because this will influence
the electrical properties surrounding the borehole
(Fig. 16.31). The resistivity or conductivity
measurements are, of course, measuring the same
property of the rock, and can be interconverted by
Resistivity ¼ 1/Conductivity. The resistivity units
are ohm-m
2 /m or simply ohm-m (Ω m). The resistivity
of a formation depends on the resistivity of the formation water, the amount of water present, and the structure and geometry of the pores, and can be expressed
by
R ¼
r  A
L
(16.10)
where R is the resistivity (ohm-m), r is the resistance
(ohms), A is the cross-sectional area (m
2 ) and L is the
length (m). Most formations have resistivities in the
range 0.2 to 1,000 ohm-m. Resistivities higher than
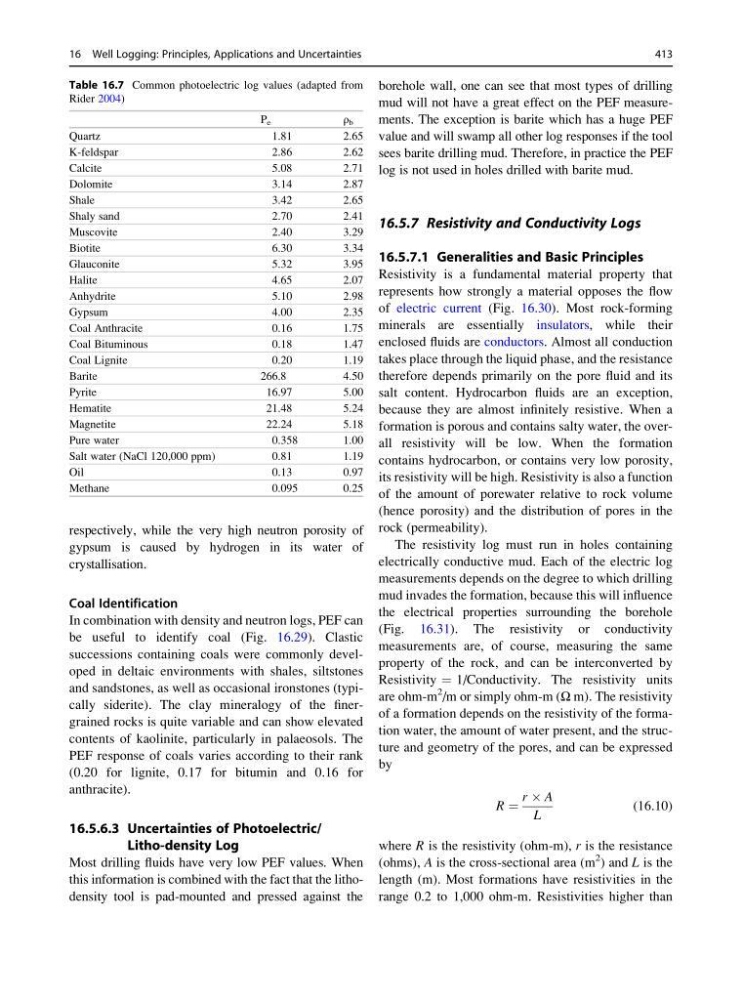
Table 16.7 Common photoelectric log values (adapted from
Rider 2004)
P e
ρ b
Quartz
1.81
2.65
K-feldspar
2.86
2.62
Calcite
5.08
2.71
Dolomite
3.14
2.87
Shale
3.42
2.65
Shaly sand
2.70
2.41
Muscovite
2.40
3.29
Biotite
6.30
3.34
Glauconite
5.32
3.95
Halite
4.65
2.07
Anhydrite
5.10
2.98
Gypsum
4.00
2.35
Coal Anthracite
0.16
1.75
Coal Bituminous
0.18
1.47
Coal Lignite
0.20
1.19
Barite
266.8
4.50
Pyrite
16.97
5.00
Hematite
21.48
5.24
Magnetite
22.24
5.18
Pure water
0.358
1.00
Salt water (NaCl 120,000 ppm)
0.81
1.19
Oil
0.13
0.97
Methane
0.095
0.25
16 Well Logging: Principles, Applications and Uncertainties
413
gypsum is caused by hydrogen in its water of
crystallisation.
Coal Identification
In combination with density and neutron logs, PEF can
be useful to identify coal (Fig. 16.29). Clastic
successions containing coals were commonly developed in deltaic environments with shales, siltstones
and sandstones, as well as occasional ironstones (typically siderite). The clay mineralogy of the finergrained rocks is quite variable and can show elevated
contents of kaolinite, particularly in palaeosols. The
PEF response of coals varies according to their rank
(0.20 for lignite, 0.17 for bitumin and 0.16 for
anthracite).
16.5.6.3 Uncertainties of Photoelectric/
Litho-density Log
Most drilling fluids have very low PEF values. When
this information is combined with the fact that the lithodensity tool is pad-mounted and pressed against the
borehole wall, one can see that most types of drilling
mud will not have a great effect on the PEF measurements. The exception is barite which has a huge PEF
value and will swamp all other log responses if the tool
sees barite drilling mud. Therefore, in practice the PEF
log is not used in holes drilled with barite mud.
16.5.7 Resistivity and Conductivity Logs
16.5.7.1 Generalities and Basic Principles
Resistivity is a fundamental material property that
represents how strongly a material opposes the flow
of electric current (Fig. 16.30). Most rock-forming
minerals are essentially insulators, while their
enclosed fluids are conductors. Almost all conduction
takes place through the liquid phase, and the resistance
therefore depends primarily on the pore fluid and its
salt content. Hydrocarbon fluids are an exception,
because they are almost infinitely resistive. When a
formation is porous and contains salty water, the overall resistivity will be low. When the formation
contains hydrocarbon, or contains very low porosity,
its resistivity will be high. Resistivity is also a function
of the amount of porewater relative to rock volume
(hence porosity) and the distribution of pores in the
rock (permeability).
The resistivity log must run in holes containing
electrically conductive mud. Each of the electric log
measurements depends on the degree to which drilling
mud invades the formation, because this will influence
the electrical properties surrounding the borehole
(Fig. 16.31). The resistivity or conductivity
measurements are, of course, measuring the same
property of the rock, and can be interconverted by
Resistivity ¼ 1/Conductivity. The resistivity units
are ohm-m
2 /m or simply ohm-m (Ω m). The resistivity
of a formation depends on the resistivity of the formation water, the amount of water present, and the structure and geometry of the pores, and can be expressed
by
R ¼
r  A
L
(16.10)
where R is the resistivity (ohm-m), r is the resistance
(ohms), A is the cross-sectional area (m
2 ) and L is the
length (m). Most formations have resistivities in the
range 0.2 to 1,000 ohm-m. Resistivities higher than
Table 16.7 Common photoelectric log values (adapted from
Rider 2004)
P e
ρ b
Quartz
1.81
2.65
K-feldspar
2.86
2.62
Calcite
5.08
2.71
Dolomite
3.14
2.87
Shale
3.42
2.65
Shaly sand
2.70
2.41
Muscovite
2.40
3.29
Biotite
6.30
3.34
Glauconite
5.32
3.95
Halite
4.65
2.07
Anhydrite
5.10
2.98
Gypsum
4.00
2.35
Coal Anthracite
0.16
1.75
Coal Bituminous
0.18
1.47
Coal Lignite
0.20
1.19
Barite
266.8
4.50
Pyrite
16.97
5.00
Hematite
21.48
5.24
Magnetite
22.24
5.18
Pure water
0.358
1.00
Salt water (NaCl 120,000 ppm)
0.81
1.19
Oil
0.13
0.97
Methane
0.095
0.25
16 Well Logging: Principles, Applications and Uncertainties
413