

where GR log is the gamma ray reading at the depth of
interest, GR min is the minimum gamma ray reading
(usually the mean minimum through a clean sandstone
or carbonate formation), GR max is the maximum
gamma ray reading (usually the mean maximum
through a shale or clay formation). Many
petrophysicists assume that V sh ¼ I GR though there
is no scientific basis for assuming a linear relation of
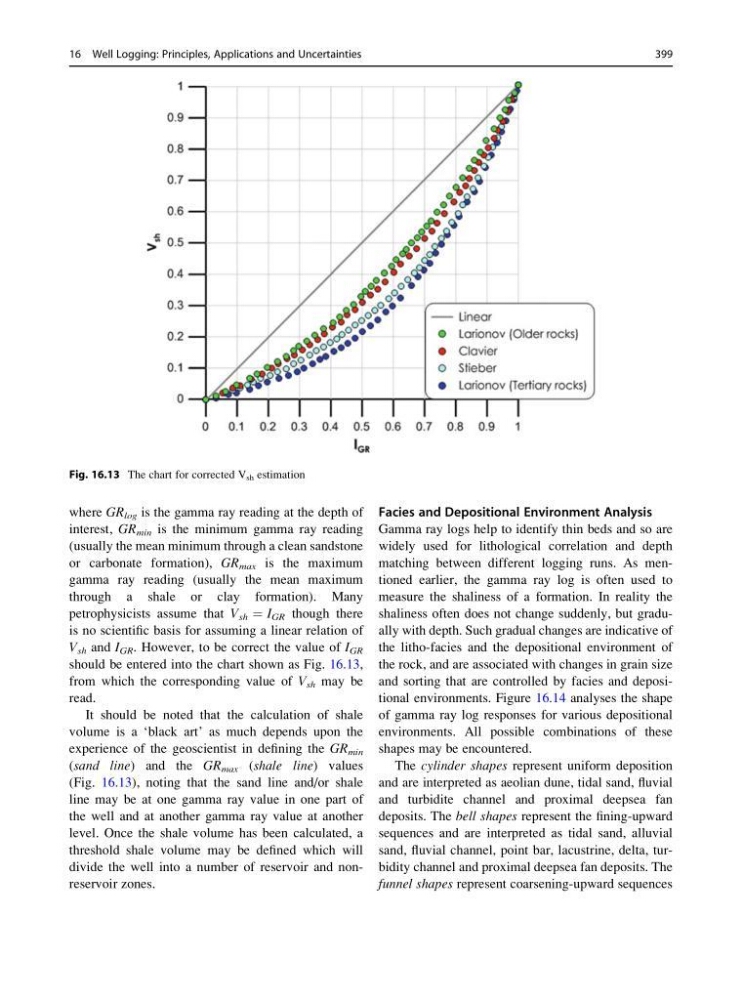
V sh and I GR . However, to be correct the value of I GR
should be entered into the chart shown as Fig. 16.13,
from which the corresponding value of V sh may be
read.
It should be noted that the calculation of shale
volume is a ‘black art’ as much depends upon the
experience of the geoscientist in defining the GR min
(sand line) and the GR max (shale line) values
(Fig. 16.13), noting that the sand line and/or shale
line may be at one gamma ray value in one part of
the well and at another gamma ray value at another
level. Once the shale volume has been calculated, a
threshold shale volume may be defined which will
divide the well into a number of reservoir and nonreservoir zones.
Facies and Depositional Environment Analysis
Gamma ray logs help to identify thin beds and so are
widely used for lithological correlation and depth
matching between different logging runs. As mentioned earlier, the gamma ray log is often used to
measure the shaliness of a formation. In reality the
shaliness often does not change suddenly, but gradually with depth. Such gradual changes are indicative of
the litho-facies and the depositional environment of
the rock, and are associated with changes in grain size
and sorting that are controlled by facies and depositional environments. Figure 16.14 analyses the shape
of gamma ray log responses for various depositional
environments. All possible combinations of these
shapes may be encountered.
The cylinder shapes represent uniform deposition
and are interpreted as aeolian dune, tidal sand, fluvial
and turbidite channel and proximal deepsea fan
deposits. The bell shapes represent the fining-upward
sequences and are interpreted as tidal sand, alluvial
sand, fluvial channel, point bar, lacustrine, delta, turbidity channel and proximal deepsea fan deposits. The
funnel shapes represent coarsening-upward sequences
Fig. 16.13 The chart for corrected V sh estimation
16 Well Logging: Principles, Applications and Uncertainties
399
interest, GR min is the minimum gamma ray reading
(usually the mean minimum through a clean sandstone
or carbonate formation), GR max is the maximum
gamma ray reading (usually the mean maximum
through a shale or clay formation). Many
petrophysicists assume that V sh ¼ I GR though there
is no scientific basis for assuming a linear relation of
V sh and I GR . However, to be correct the value of I GR
should be entered into the chart shown as Fig. 16.13,
from which the corresponding value of V sh may be
read.
It should be noted that the calculation of shale
volume is a ‘black art’ as much depends upon the
experience of the geoscientist in defining the GR min
(sand line) and the GR max (shale line) values
(Fig. 16.13), noting that the sand line and/or shale
line may be at one gamma ray value in one part of
the well and at another gamma ray value at another
level. Once the shale volume has been calculated, a
threshold shale volume may be defined which will
divide the well into a number of reservoir and nonreservoir zones.
Facies and Depositional Environment Analysis
Gamma ray logs help to identify thin beds and so are
widely used for lithological correlation and depth
matching between different logging runs. As mentioned earlier, the gamma ray log is often used to
measure the shaliness of a formation. In reality the
shaliness often does not change suddenly, but gradually with depth. Such gradual changes are indicative of
the litho-facies and the depositional environment of
the rock, and are associated with changes in grain size
and sorting that are controlled by facies and depositional environments. Figure 16.14 analyses the shape
of gamma ray log responses for various depositional
environments. All possible combinations of these
shapes may be encountered.
The cylinder shapes represent uniform deposition
and are interpreted as aeolian dune, tidal sand, fluvial
and turbidite channel and proximal deepsea fan
deposits. The bell shapes represent the fining-upward
sequences and are interpreted as tidal sand, alluvial
sand, fluvial channel, point bar, lacustrine, delta, turbidity channel and proximal deepsea fan deposits. The
funnel shapes represent coarsening-upward sequences
Fig. 16.13 The chart for corrected V sh estimation
16 Well Logging: Principles, Applications and Uncertainties
399