

then be said to be in a hydrostatic state. When significantly higher pressure is measured it is called overpressure, and underpressure also exists in some basins.
There may also be a pressure gradient in the porewater
which is different from the hydrostatic, and then there
will be a fluid flow which is a function of the permeability and the viscosity. The flow may be relatively
constant over long time, but if the pore pressure
changes over a relatively short time the flow is said
to be transient. This would be the case with fluid flow
related to earthquakes.
In offshore sedimentary basins the pore fluid pressure (u) measured in oil or water is a result of several
contributions:
u ¼ ρ p gH p þ ρ w gH w þ ρ sw gH d þ Δu
(11.4)
where ρ p gH p is the pressure contribution from a petroleum column of height H p with the density of petroleum ρ p , ρ w gH w is the pressure due to a watersaturated sequence (H w ), and ρ sw gH d is the pressure
contribution of the seawater column (H sw ) density ρ sw .
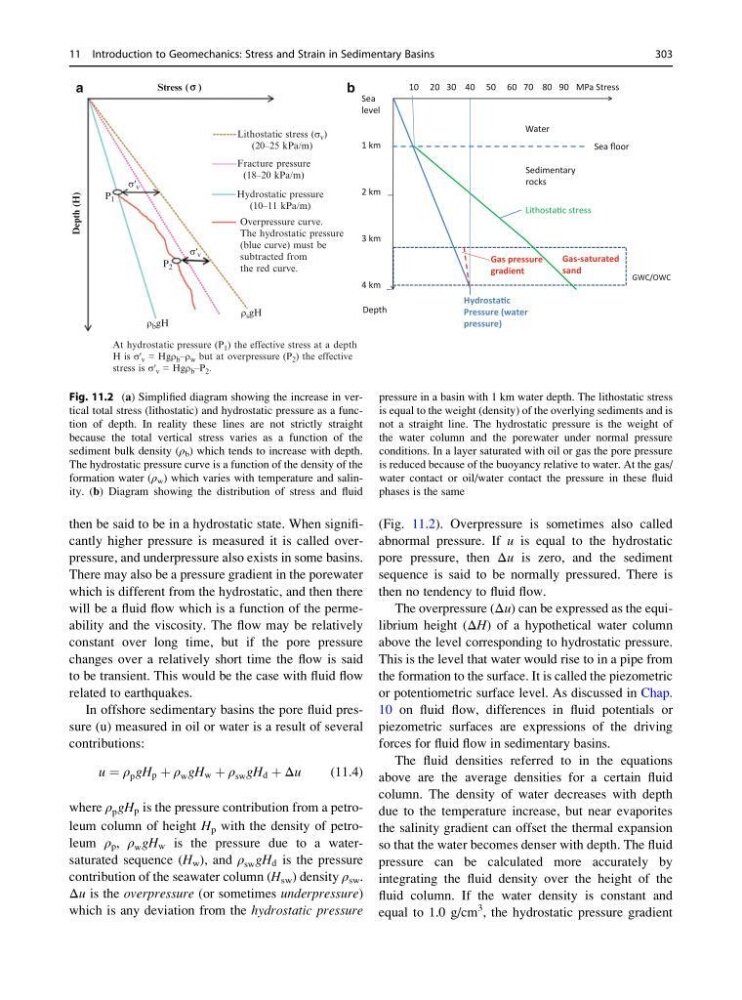
Δu is the overpressure (or sometimes underpressure)
which is any deviation from the hydrostatic pressure
(Fig. 11.2). Overpressure is sometimes also called
abnormal pressure. If u is equal to the hydrostatic
pore pressure, then Δu is zero, and the sediment
sequence is said to be normally pressured. There is
then no tendency to fluid flow.
The overpressure (Δu) can be expressed as the equilibrium height (ΔH) of a hypothetical water column
above the level corresponding to hydrostatic pressure.
This is the level that water would rise to in a pipe from
the formation to the surface. It is called the piezometric
or potentiometric surface level. As discussed in Chap.
10 on fluid flow, differences in fluid potentials or
piezometric surfaces are expressions of the driving
forces for fluid flow in sedimentary basins.
The fluid densities referred to in the equations
above are the average densities for a certain fluid
column. The density of water decreases with depth
due to the temperature increase, but near evaporites
the salinity gradient can offset the thermal expansion
so that the water becomes denser with depth. The fluid
pressure can be calculated more accurately by
integrating the fluid density over the height of the
fluid column. If the water density is constant and
equal to 1.0 g/cm
3 , the hydrostatic pressure gradient
Lithostatic stress (σ v )
(20–25 kPa/m)
Fracture pressure
(18–20 kPa/m)
Hydrostatic pressure
(10–11 kPa/m)
Overpressure curve.
The hydrostatic pressure
(blue curve) must be
subtracted from
the red curve.
Depth (H)
Stress ( )
a
b
At hydrostatic pressure (P 1 ) the effective stress at a depth
H is σ′ v = Hgρ b –ρ w but at overpressure (P 2 ) the effective
stress is σ′ v = Hgρ b –P 2 .
ρ s gH
ρ b gH
P 2
P 1
σ′ v
σ′ v
10 20 30 40 50 60 70 80 90 MPa Stress
Sea
level
1 km
2 km
3 km
4 km
Sea floor
LithostaƟc stress
HydrostaƟc
Pressure (water
pressure)
Gas-saturated
sand
Gas pressure
gradient
Depth
GWC/OWC
Water
Sedimentary
rocks
Fig. 11.2 (a) Simplified diagram showing the increase in vertical total stress (lithostatic) and hydrostatic pressure as a function of depth. In reality these lines are not strictly straight
because the total vertical stress varies as a function of the
sediment bulk density (ρ b ) which tends to increase with depth.
The hydrostatic pressure curve is a function of the density of the
formation water (ρ w ) which varies with temperature and salinity. (b) Diagram showing the distribution of stress and fluid
pressure in a basin with 1 km water depth. The lithostatic stress
is equal to the weight (density) of the overlying sediments and is
not a straight line. The hydrostatic pressure is the weight of
the water column and the porewater under normal pressure
conditions. In a layer saturated with oil or gas the pore pressure
is reduced because of the buoyancy relative to water. At the gas/
water contact or oil/water contact the pressure in these fluid
phases is the same
11 Introduction to Geomechanics: Stress and Strain in Sedimentary Basins
303
There may also be a pressure gradient in the porewater
which is different from the hydrostatic, and then there
will be a fluid flow which is a function of the permeability and the viscosity. The flow may be relatively
constant over long time, but if the pore pressure
changes over a relatively short time the flow is said
to be transient. This would be the case with fluid flow
related to earthquakes.
In offshore sedimentary basins the pore fluid pressure (u) measured in oil or water is a result of several
contributions:
u ¼ ρ p gH p þ ρ w gH w þ ρ sw gH d þ Δu
(11.4)
where ρ p gH p is the pressure contribution from a petroleum column of height H p with the density of petroleum ρ p , ρ w gH w is the pressure due to a watersaturated sequence (H w ), and ρ sw gH d is the pressure
contribution of the seawater column (H sw ) density ρ sw .
Δu is the overpressure (or sometimes underpressure)
which is any deviation from the hydrostatic pressure
(Fig. 11.2). Overpressure is sometimes also called
abnormal pressure. If u is equal to the hydrostatic
pore pressure, then Δu is zero, and the sediment
sequence is said to be normally pressured. There is
then no tendency to fluid flow.
The overpressure (Δu) can be expressed as the equilibrium height (ΔH) of a hypothetical water column
above the level corresponding to hydrostatic pressure.
This is the level that water would rise to in a pipe from
the formation to the surface. It is called the piezometric
or potentiometric surface level. As discussed in Chap.
10 on fluid flow, differences in fluid potentials or
piezometric surfaces are expressions of the driving
forces for fluid flow in sedimentary basins.
The fluid densities referred to in the equations
above are the average densities for a certain fluid
column. The density of water decreases with depth
due to the temperature increase, but near evaporites
the salinity gradient can offset the thermal expansion
so that the water becomes denser with depth. The fluid
pressure can be calculated more accurately by
integrating the fluid density over the height of the
fluid column. If the water density is constant and
equal to 1.0 g/cm
3 , the hydrostatic pressure gradient
Lithostatic stress (σ v )
(20–25 kPa/m)
Fracture pressure
(18–20 kPa/m)
Hydrostatic pressure
(10–11 kPa/m)
Overpressure curve.
The hydrostatic pressure
(blue curve) must be
subtracted from
the red curve.
Depth (H)
Stress ( )
a
b
At hydrostatic pressure (P 1 ) the effective stress at a depth
H is σ′ v = Hgρ b –ρ w but at overpressure (P 2 ) the effective
stress is σ′ v = Hgρ b –P 2 .
ρ s gH
ρ b gH
P 2
P 1
σ′ v
σ′ v
10 20 30 40 50 60 70 80 90 MPa Stress
Sea
level
1 km
2 km
3 km
4 km
Sea floor
LithostaƟc stress
HydrostaƟc
Pressure (water
pressure)
Gas-saturated
sand
Gas pressure
gradient
Depth
GWC/OWC
Water
Sedimentary
rocks
Fig. 11.2 (a) Simplified diagram showing the increase in vertical total stress (lithostatic) and hydrostatic pressure as a function of depth. In reality these lines are not strictly straight
because the total vertical stress varies as a function of the
sediment bulk density (ρ b ) which tends to increase with depth.
The hydrostatic pressure curve is a function of the density of the
formation water (ρ w ) which varies with temperature and salinity. (b) Diagram showing the distribution of stress and fluid
pressure in a basin with 1 km water depth. The lithostatic stress
is equal to the weight (density) of the overlying sediments and is
not a straight line. The hydrostatic pressure is the weight of
the water column and the porewater under normal pressure
conditions. In a layer saturated with oil or gas the pore pressure
is reduced because of the buoyancy relative to water. At the gas/
water contact or oil/water contact the pressure in these fluid
phases is the same
11 Introduction to Geomechanics: Stress and Strain in Sedimentary Basins
303