

Quantitative Studies of Alluvial Architecture
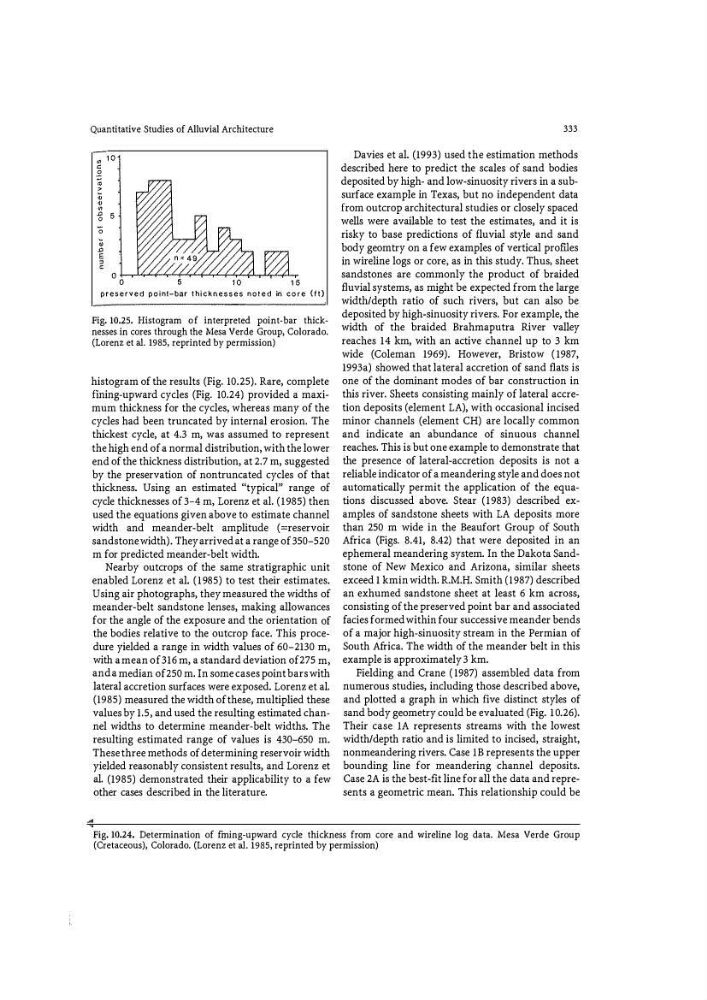
preserved point-bar thicknesses noted in core (ft)
Fig. 10.25. Histogram of interpreted point-bar thicknesses in cores through the Mesa Verde Group, Colorado.
(Lorenz et al. 1985, reprinted by permission)
histogram of the results (Fig. 10.25). Rare, complete
fining-upward cycles (Fig. 10.24) provided a maximum thickness for the cycles, whereas many of the
cycles had been truncated by internal erosion. The
thickest cycle, at 4.3 m, was assumed to represent
the high end of a normal distribution, with the lower
end of the thickness distribution, at 2. 7 m, suggested
by the preservation of nontruncated cycles of that
thickness. Using an estimated ''typical" range of
cycle thicknesses of 3-4 m, Lorenz et al. (1985) then
used the equations given above to estimate channel
width and meander-belt amplitude (;::;: reservoir
sandstone width). They arrived at a range of 350-520
m for predicted meander-belt width.
Nearby outcrops of the same stratigraphic unit
enabled Lorenz et al. (1985) to test their estimates.
Using air photographs, they measured the widths of
meander-belt sandstone lenses, making allowances
for the angle of the exposure and the orientation of
the bodies relative to the outcrop face. This procedure yielded a range in width values of 60-2130 m,
with a mean of316 m, a standard deviation of275 m,
and a median of250 m. In some cases point bars with
lateral accretion surfaces were exposed. Lorenz et al.
(1985) measured the width of these, multiplied these
values by 1.5, and used the resulting estimated channel widths to determine meander-belt widths. The
resulting estimated range of values is 430-650 m.
These three methods of determining reservoir width
yielded reasonably consistent results, and Lorenz et
al. (1985) demonstrated their applicability to a few
other cases described in the literature.
333
Davies et al. (1993) used the estimation methods
described here to predict the scales of sand bodies
deposited by high- and low-sinuosity rivers in a subsurface example in Texas, but no independent data
from outcrop architectural studies or closely spaced
wells were available to test the estimates, and it is
risky to base predictions of fluvial style and sand
body geomtry on a few examples of vertical pro fries
in wireline logs or core� as in this study. Thus� sheet
sandstones are commonly the product of braided
fl uvial systems, as might be expet;:ted from the large
width/depth ratio of such rivers, but can also be
deposited by high-sinuosity rivers. For example, the
width of the braided Brahmaputra River valley
reaches 14 km, with an active channel up to 3 km
wide (Coleman 1969). However, Bristow (1987,
1993a) showed that lateral accretion of sand flats is
one of the dominant modes of bar construction in
this river. Sheets consisting mainly of lateral accretion deposits (element LA), with occasional incised
minor channels (element CH) are locally common
and indicate an abundance of sinuous channel
reaches. This is but one example to demonstrate that
the presence of lateral-accretion deposits is not a
reliable indicator of a meandering style and does not
automatically permit the application of the equations discussed above. Stear (1983) described examples of sandstone sheets with LA deposits more
than 250 m wide in the Beaufort Group of South
Africa (Figs. 8.41, 8.42) that were deposited in an
ephemeral meandering system. In the Dakota Sandstone of New Mexico and Arizona, similar sheets
exceed 1 kmin width. R.M.H. Smith (1987) described
an exhumed sandstone sheet at least 6 km across,
consisting of the preserved point bar and associated
facies formed within four successive meander bends
of a major high-sinuosity stream in the Permian of
South Africa. The width of the meander belt in this
example is approximately 3 km.
Fielding and Crane (1987) assembled data from
numerous studies, including those described above,
and plotted a graph in which five distinct styles of
sand body geometry could be evaluated (Fig. 10.26).
Their case IA represents streams with the lowest
width/depth ratio and is limited to incised, straight,
nonmeandering rivers. Case IB represents the upper
bounding line for meandering channel deposits.
Case 2A is the best-fit line for all the data and represents a geometriC mean. This relationship could be
Fig. 10.24. Determination of fm ing-upward cycle thickness from core and wireline log data. Mesa Verde Group
(Cretaceous), Colorado. (Lorenz et al. 1985, reprinted by permission)
preserved point-bar thicknesses noted in core (ft)
Fig. 10.25. Histogram of interpreted point-bar thicknesses in cores through the Mesa Verde Group, Colorado.
(Lorenz et al. 1985, reprinted by permission)
histogram of the results (Fig. 10.25). Rare, complete
fining-upward cycles (Fig. 10.24) provided a maximum thickness for the cycles, whereas many of the
cycles had been truncated by internal erosion. The
thickest cycle, at 4.3 m, was assumed to represent
the high end of a normal distribution, with the lower
end of the thickness distribution, at 2. 7 m, suggested
by the preservation of nontruncated cycles of that
thickness. Using an estimated ''typical" range of
cycle thicknesses of 3-4 m, Lorenz et al. (1985) then
used the equations given above to estimate channel
width and meander-belt amplitude (;::;: reservoir
sandstone width). They arrived at a range of 350-520
m for predicted meander-belt width.
Nearby outcrops of the same stratigraphic unit
enabled Lorenz et al. (1985) to test their estimates.
Using air photographs, they measured the widths of
meander-belt sandstone lenses, making allowances
for the angle of the exposure and the orientation of
the bodies relative to the outcrop face. This procedure yielded a range in width values of 60-2130 m,
with a mean of316 m, a standard deviation of275 m,
and a median of250 m. In some cases point bars with
lateral accretion surfaces were exposed. Lorenz et al.
(1985) measured the width of these, multiplied these
values by 1.5, and used the resulting estimated channel widths to determine meander-belt widths. The
resulting estimated range of values is 430-650 m.
These three methods of determining reservoir width
yielded reasonably consistent results, and Lorenz et
al. (1985) demonstrated their applicability to a few
other cases described in the literature.
333
Davies et al. (1993) used the estimation methods
described here to predict the scales of sand bodies
deposited by high- and low-sinuosity rivers in a subsurface example in Texas, but no independent data
from outcrop architectural studies or closely spaced
wells were available to test the estimates, and it is
risky to base predictions of fluvial style and sand
body geomtry on a few examples of vertical pro fries
in wireline logs or core� as in this study. Thus� sheet
sandstones are commonly the product of braided
fl uvial systems, as might be expet;:ted from the large
width/depth ratio of such rivers, but can also be
deposited by high-sinuosity rivers. For example, the
width of the braided Brahmaputra River valley
reaches 14 km, with an active channel up to 3 km
wide (Coleman 1969). However, Bristow (1987,
1993a) showed that lateral accretion of sand flats is
one of the dominant modes of bar construction in
this river. Sheets consisting mainly of lateral accretion deposits (element LA), with occasional incised
minor channels (element CH) are locally common
and indicate an abundance of sinuous channel
reaches. This is but one example to demonstrate that
the presence of lateral-accretion deposits is not a
reliable indicator of a meandering style and does not
automatically permit the application of the equations discussed above. Stear (1983) described examples of sandstone sheets with LA deposits more
than 250 m wide in the Beaufort Group of South
Africa (Figs. 8.41, 8.42) that were deposited in an
ephemeral meandering system. In the Dakota Sandstone of New Mexico and Arizona, similar sheets
exceed 1 kmin width. R.M.H. Smith (1987) described
an exhumed sandstone sheet at least 6 km across,
consisting of the preserved point bar and associated
facies formed within four successive meander bends
of a major high-sinuosity stream in the Permian of
South Africa. The width of the meander belt in this
example is approximately 3 km.
Fielding and Crane (1987) assembled data from
numerous studies, including those described above,
and plotted a graph in which five distinct styles of
sand body geometry could be evaluated (Fig. 10.26).
Their case IA represents streams with the lowest
width/depth ratio and is limited to incised, straight,
nonmeandering rivers. Case IB represents the upper
bounding line for meandering channel deposits.
Case 2A is the best-fit line for all the data and represents a geometriC mean. This relationship could be
Fig. 10.24. Determination of fm ing-upward cycle thickness from core and wireline log data. Mesa Verde Group
(Cretaceous), Colorado. (Lorenz et al. 1985, reprinted by permission)