

A
294
The Stratigraphic Architecture of Fluvial Depositional Systems
"
.s
�
;::
Position (m)
�
�
�
@
•
""'
""'
""'
"'"
600
"""
71110
000
""'
"""'
�
•
5
,
drainage and location of entry point of drainage
into a basin
3. Reconstruction of local and regional paleoflow
patterns
4. Vertical changes in flow direction through a
stratigraphic section as indicators of interacting
fluvial systems (e.g., trunk and tributary drainages), or vertical changes in orientation of a system, in response to paleogeographic changes in a
basin
An example of the use of detailed paleocurrent
information to reconstruct channel and bar orienta�
tion is- illustrated in Figs. 9.58 and 9.59, taken from
the author's study of the Castlegate Sandstone in
Utab (Miall !993, !994). At a location named Tusher
Canyon-B, the outcrop is subdivisible into a series of
elements separated by fifth-order bounding surfaces. The exposure extends around a bend above a
dry creek bed. Figure 9.58A and B illustrate the
paleocurrent data for the entire outcrop and for one
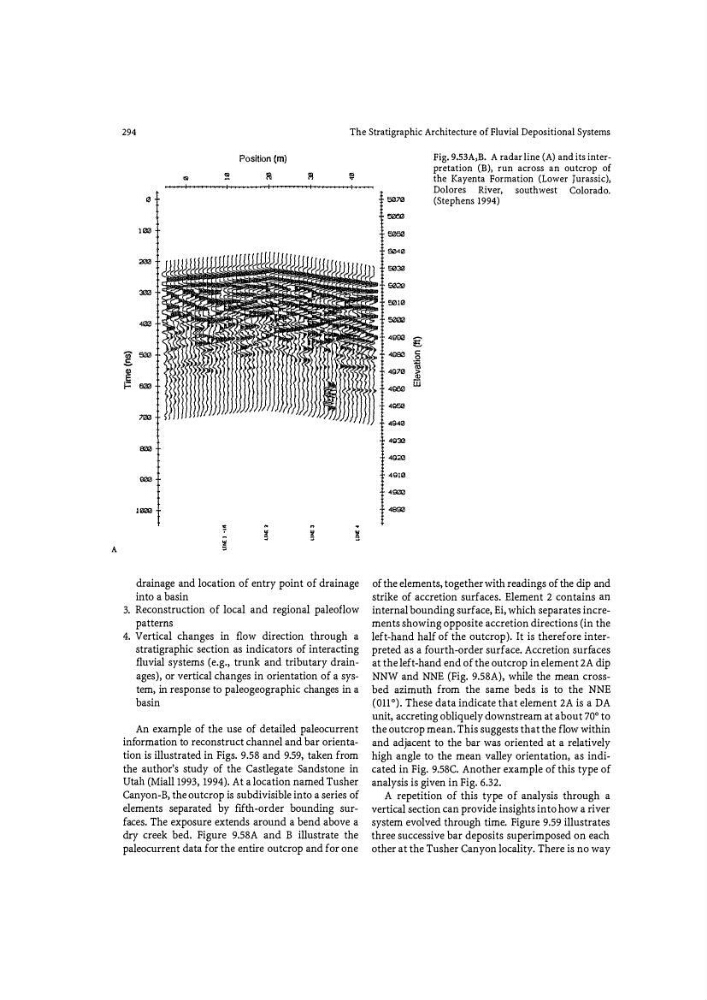
Fig. 9.53A,B. A radar line (A) and its interpretation (B), run across an outcrop of
the Kayenta Formation (Lower Jurassic),
Dolores River, southwest Colorado.
Si>70
(Stephens 1994)
""""
""""
"""
"'""
"""
6010
""""
4'"" §:
4"""
c
I
4970
4QOO
""''
4940
4Q32
4900
4910
·499il
of the elements, together with readings of the dip and
strike of accretion surfaces. Element 2 contains an
internal bounding surface, Ei, which separates increments showing opposite accretion directions (in the
left-hand half of the outcrop). It is therefore interpreted as a fo urth-order surface. Accretion surfaces
at the left-hand end of the outcrop in element 2A dip
NNW and NNE (Fig. 9.58A), while the mean crossbed azimuth from the same beds is to the NNE
(011'). These data indicate that element 2A is aD A
unit, accreting obliquely downstream at about 70° to
the outcrop mean. This suggests that the flow within
and adjacent to the bar was oriented at a relatively
high angle to the mean valley orientation, as indi�
cated in Fig. 9.58C. Another example of this type of
analysis is given in Fig. 6.32.
A repetition of this type of analysis through a
vertical section can provide insights into how a river
system evolved through time. Figure 9.59 illustrates
three successive bar deposits superimposed on each
other at the Tusher Canyon locality. There is no way
294
The Stratigraphic Architecture of Fluvial Depositional Systems
"
.s
�
;::
Position (m)
�
�
�
@
•
""'
""'
""'
"'"
600
"""
71110
000
""'
"""'
�
•
5
,
drainage and location of entry point of drainage
into a basin
3. Reconstruction of local and regional paleoflow
patterns
4. Vertical changes in flow direction through a
stratigraphic section as indicators of interacting
fluvial systems (e.g., trunk and tributary drainages), or vertical changes in orientation of a system, in response to paleogeographic changes in a
basin
An example of the use of detailed paleocurrent
information to reconstruct channel and bar orienta�
tion is- illustrated in Figs. 9.58 and 9.59, taken from
the author's study of the Castlegate Sandstone in
Utab (Miall !993, !994). At a location named Tusher
Canyon-B, the outcrop is subdivisible into a series of
elements separated by fifth-order bounding surfaces. The exposure extends around a bend above a
dry creek bed. Figure 9.58A and B illustrate the
paleocurrent data for the entire outcrop and for one
Fig. 9.53A,B. A radar line (A) and its interpretation (B), run across an outcrop of
the Kayenta Formation (Lower Jurassic),
Dolores River, southwest Colorado.
Si>70
(Stephens 1994)
""""
""""
"""
"'""
"""
6010
""""
4'"" §:
4"""
c
I
4970
4QOO
""''
4940
4Q32
4900
4910
·499il
of the elements, together with readings of the dip and
strike of accretion surfaces. Element 2 contains an
internal bounding surface, Ei, which separates increments showing opposite accretion directions (in the
left-hand half of the outcrop). It is therefore interpreted as a fo urth-order surface. Accretion surfaces
at the left-hand end of the outcrop in element 2A dip
NNW and NNE (Fig. 9.58A), while the mean crossbed azimuth from the same beds is to the NNE
(011'). These data indicate that element 2A is aD A
unit, accreting obliquely downstream at about 70° to
the outcrop mean. This suggests that the flow within
and adjacent to the bar was oriented at a relatively
high angle to the mean valley orientation, as indi�
cated in Fig. 9.58C. Another example of this type of
analysis is given in Fig. 6.32.
A repetition of this type of analysis through a
vertical section can provide insights into how a river
system evolved through time. Figure 9.59 illustrates
three successive bar deposits superimposed on each
other at the Tusher Canyon locality. There is no way