

282
The Stratigraphic Architecture of Fluvial Depositional Systems
··. ·
I. ,,
'"
:r:· �
/
'
' �- ·
tl 0 ,' } : • ''
-jo··'
: / _. : ,'
v
/:· ; /:. : :
•
0
,-·
•
.'
1IO•m
A . '
Conlou< lnle
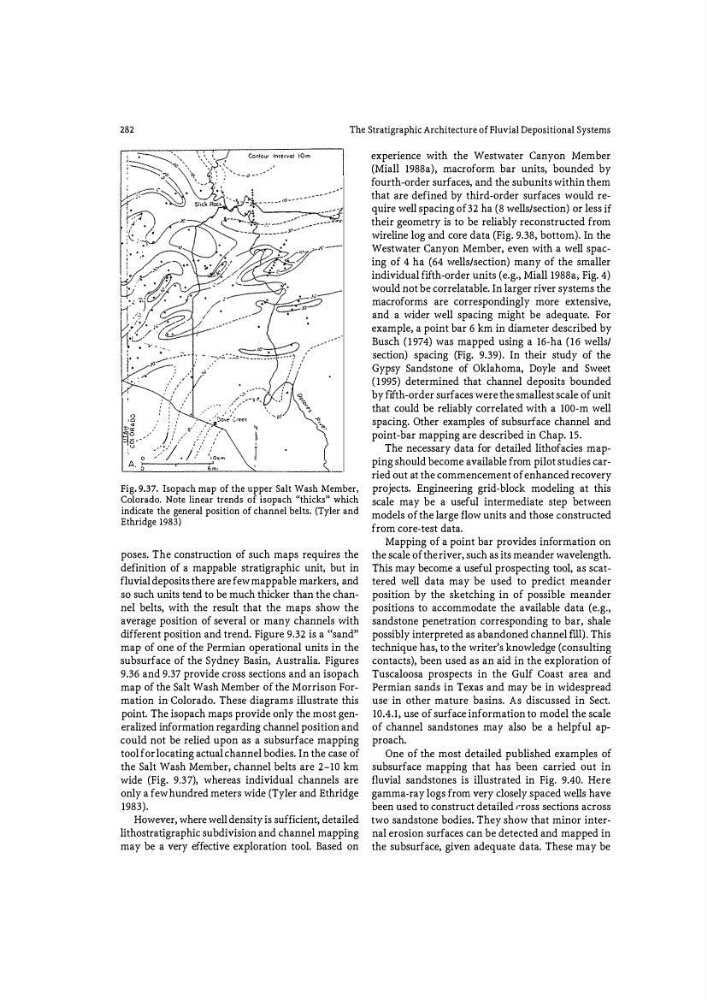
Colorado. Note linear trends of isopach "thicks" which
indicate the general position of channel belts. (Tyler and
Ethridge 1983)
poses. The construction of such maps requires the
definition of a mappable stratigraphic unit) but in
fluvial deposits there are few mappable markers, and
so such units tend to be much thicker than the channel belts, with the result that the maps show the
average position of several or many channels with
different position and trend. Figure 9.32 is a
subsurface of the Sydney Basin, Australia. Figures
9.36 and 9.37 provide cross sections and an isopach
map of the Salt Wash Member of the Morrison Formation in· Colorado. These diagrams illustrate this
point. The isopach maps provide only the most generalized information regarding channel position and
could not be relied upon as a subsurface mapping
tool for locating actual channel bodies. In the case of
the Salt Wash Member, channel belts are 2-10 km
wide (Fig. 9.3 7), whereas individual channels are
only a few hundred meters wide (Tyler and Ethridge
1983).
However, where well density is sufficient, detailed
lithostratigraphic subdivision and channel mapping
may be a very effective exploration tool. Based on
experience with the Westwater Canyon Member
(Miall 1988a), macroform bar units, bounded by
fo urth-order surfaces, and the subunits within them
that are defined by third-order surfaces would require well spacing of32 ha (8 wells/section) or less if
their geometry is to be reliably reconstructed from
wireline log and core data (Fig. 9.38, bottom). In the
Westwater Canyon Member, even with a well spacing of 4 ha (64 wells/section) many of the smaller
individual fifth-order units (e.g., Miall 1988a, Fig. 4)
would not be correlatable. In larger river systems the
macroforms are correspondingly more extensive,
and a wider well spacing might be adequate. For
example, a point bar 6 km in diameter described by
Busch (1974) was mapped using a 16-ha (16 wells/
section) spacing (Fig. 9.39). In their study of the
Gypsy Sandstone of Oklahoma, Doyle and Sweet
(1995) determined that channel deposits bounded
by fifth-order surfaces were the smallest scale of unit
that could be reliably correlated with a 100-m well
spacing. Other examples of subsurface channel and
point-bar mapping are described in Chap. 15.
The necessary data for detailed lithofacies mapping shonld become available from pilot studies carried out at the commencement of enhanced recovery
projects. Engineering grid-block modeling at this
scale may be a useful intermediate step between
models of the large flow units and those constructed
from core-test data.
Mapping of a point bar provides information on
the scale of the river, such as its meander wavelength.
This may become a useful prospecting tool, as scattered well data may be used to predict meander
position by the sketching in of possible meander
positions to accommodate the available data (e.g.,
sandstone penetration corresponding to bar, shale
possibly interpreted as abandoned channel fill ). This
technique has, to the writer's knowledge (consulting
contacts), been used as an aid in the exploration of
Tuscaloosa prospects in the Gulf Coast area and
Permian sands in Texas and may be in widespread
use in other mature basins. As discussed in Sect.
10.4.1, use of surface information to model the scale
of channel sandstones may also be a helpful approach.
One of the most detailed published examples of
subsurface mapping that has been carried out in
fluvial sandstones is illustrated in Fig. 9.40. Here
gamma-ray logs from very closely spaced wells have
been used to construct detailed cross sections across
two sandstone bodies. They show that minor inter�
nal erosion surfaces can be detected and mapped in
the subsurface, given adequate data. These may be
The Stratigraphic Architecture of Fluvial Depositional Systems
··. ·
I. ,,
'"
:r:· �
/
'
' �- ·
tl 0 ,' } : • ''
-jo··'
: / _. : ,'
v
/:· ; /:. : :
•
0
,-·
•
.'
1IO•m
A . '
Conlou< lnle
Colorado. Note linear trends of isopach "thicks" which
indicate the general position of channel belts. (Tyler and
Ethridge 1983)
poses. The construction of such maps requires the
definition of a mappable stratigraphic unit) but in
fluvial deposits there are few mappable markers, and
so such units tend to be much thicker than the channel belts, with the result that the maps show the
average position of several or many channels with
different position and trend. Figure 9.32 is a
subsurface of the Sydney Basin, Australia. Figures
9.36 and 9.37 provide cross sections and an isopach
map of the Salt Wash Member of the Morrison Formation in· Colorado. These diagrams illustrate this
point. The isopach maps provide only the most generalized information regarding channel position and
could not be relied upon as a subsurface mapping
tool for locating actual channel bodies. In the case of
the Salt Wash Member, channel belts are 2-10 km
wide (Fig. 9.3 7), whereas individual channels are
only a few hundred meters wide (Tyler and Ethridge
1983).
However, where well density is sufficient, detailed
lithostratigraphic subdivision and channel mapping
may be a very effective exploration tool. Based on
experience with the Westwater Canyon Member
(Miall 1988a), macroform bar units, bounded by
fo urth-order surfaces, and the subunits within them
that are defined by third-order surfaces would require well spacing of32 ha (8 wells/section) or less if
their geometry is to be reliably reconstructed from
wireline log and core data (Fig. 9.38, bottom). In the
Westwater Canyon Member, even with a well spacing of 4 ha (64 wells/section) many of the smaller
individual fifth-order units (e.g., Miall 1988a, Fig. 4)
would not be correlatable. In larger river systems the
macroforms are correspondingly more extensive,
and a wider well spacing might be adequate. For
example, a point bar 6 km in diameter described by
Busch (1974) was mapped using a 16-ha (16 wells/
section) spacing (Fig. 9.39). In their study of the
Gypsy Sandstone of Oklahoma, Doyle and Sweet
(1995) determined that channel deposits bounded
by fifth-order surfaces were the smallest scale of unit
that could be reliably correlated with a 100-m well
spacing. Other examples of subsurface channel and
point-bar mapping are described in Chap. 15.
The necessary data for detailed lithofacies mapping shonld become available from pilot studies carried out at the commencement of enhanced recovery
projects. Engineering grid-block modeling at this
scale may be a useful intermediate step between
models of the large flow units and those constructed
from core-test data.
Mapping of a point bar provides information on
the scale of the river, such as its meander wavelength.
This may become a useful prospecting tool, as scattered well data may be used to predict meander
position by the sketching in of possible meander
positions to accommodate the available data (e.g.,
sandstone penetration corresponding to bar, shale
possibly interpreted as abandoned channel fill ). This
technique has, to the writer's knowledge (consulting
contacts), been used as an aid in the exploration of
Tuscaloosa prospects in the Gulf Coast area and
Permian sands in Texas and may be in widespread
use in other mature basins. As discussed in Sect.
10.4.1, use of surface information to model the scale
of channel sandstones may also be a helpful approach.
One of the most detailed published examples of
subsurface mapping that has been carried out in
fluvial sandstones is illustrated in Fig. 9.40. Here
gamma-ray logs from very closely spaced wells have
been used to construct detailed cross sections across
two sandstone bodies. They show that minor inter�
nal erosion surfaces can be detected and mapped in
the subsurface, given adequate data. These may be