

68
Statistical Methods for Estimating Petroleum Resources
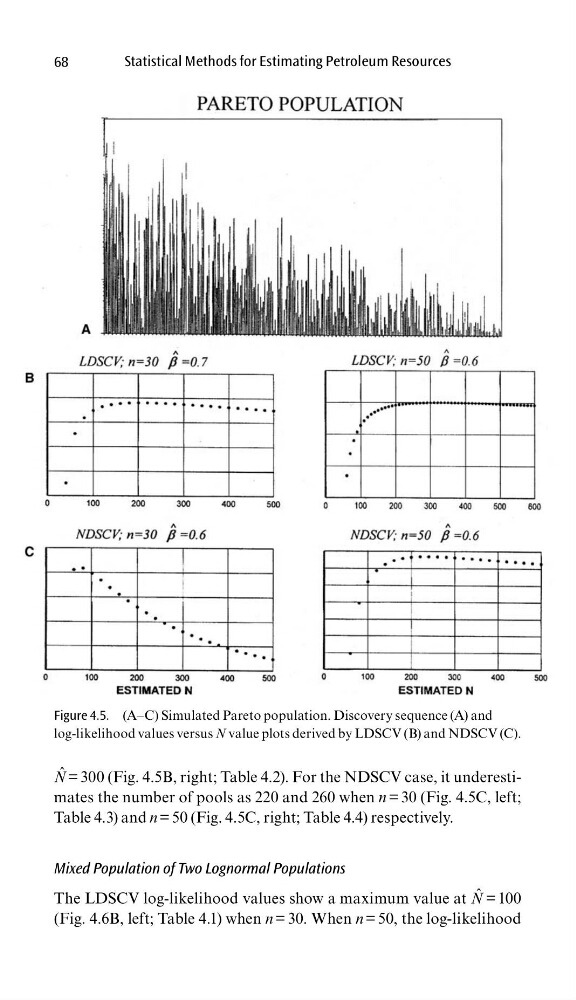
N ˆ = 300 (Fig. 4.5B, right; Table 4.2). For the NDSCV case, it underestimates the number of pools as 220 and 260 when n = 30 (Fig. 4.5C, left;
Table 4.3) and n = 50 (Fig. 4.5C, right; Table 4.4) respectively.
Mixed Population of Two Lognormal Populations
The LDSCV log-likelihood values show a maximum value at N ˆ = 100
(Fig. 4.6B, left; Table 4.1) when n = 30. When n = 50, the log-likelihood
Figure 4.5. (A–C) Simulated Pareto population. Discovery sequence (A) and
log-likelihood values versus N value plots derived by LDSCV (B) and NDSCV (C).
Statistical Methods for Estimating Petroleum Resources
N ˆ = 300 (Fig. 4.5B, right; Table 4.2). For the NDSCV case, it underestimates the number of pools as 220 and 260 when n = 30 (Fig. 4.5C, left;
Table 4.3) and n = 50 (Fig. 4.5C, right; Table 4.4) respectively.
Mixed Population of Two Lognormal Populations
The LDSCV log-likelihood values show a maximum value at N ˆ = 100
(Fig. 4.6B, left; Table 4.1) when n = 30. When n = 50, the log-likelihood
Figure 4.5. (A–C) Simulated Pareto population. Discovery sequence (A) and
log-likelihood values versus N value plots derived by LDSCV (B) and NDSCV (C).