

More about Discovery Process Models
67
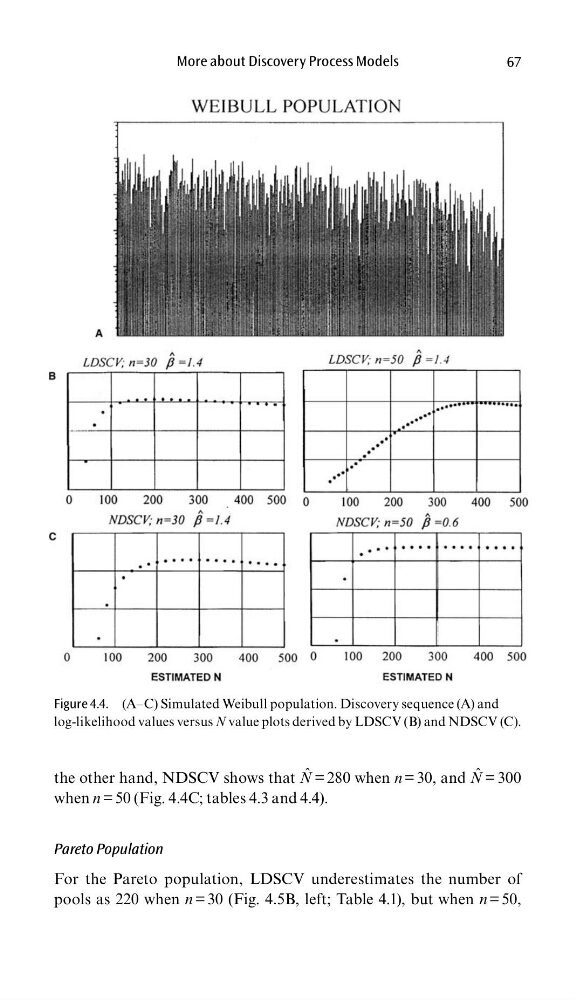
the other hand, NDSCV shows that N ˆ = 280 when n = 30, and N ˆ = 300
when n = 50 (Fig. 4.4C; tables 4.3 and 4.4).
Pareto Population
For the Pareto population, LDSCV underestimates the number of
pools as 220 when n = 30 (Fig. 4.5B, left; Table 4.1), but when n = 50,
Figure 4.4. (A–C) Simulated Weibull population. Discovery sequence (A) and
log-likelihood values versus N value plots derived by LDSCV (B) and NDSCV (C).
67
the other hand, NDSCV shows that N ˆ = 280 when n = 30, and N ˆ = 300
when n = 50 (Fig. 4.4C; tables 4.3 and 4.4).
Pareto Population
For the Pareto population, LDSCV underestimates the number of
pools as 220 when n = 30 (Fig. 4.5B, left; Table 4.1), but when n = 50,
Figure 4.4. (A–C) Simulated Weibull population. Discovery sequence (A) and
log-likelihood values versus N value plots derived by LDSCV (B) and NDSCV (C).