

Estimating Mature Plays
47
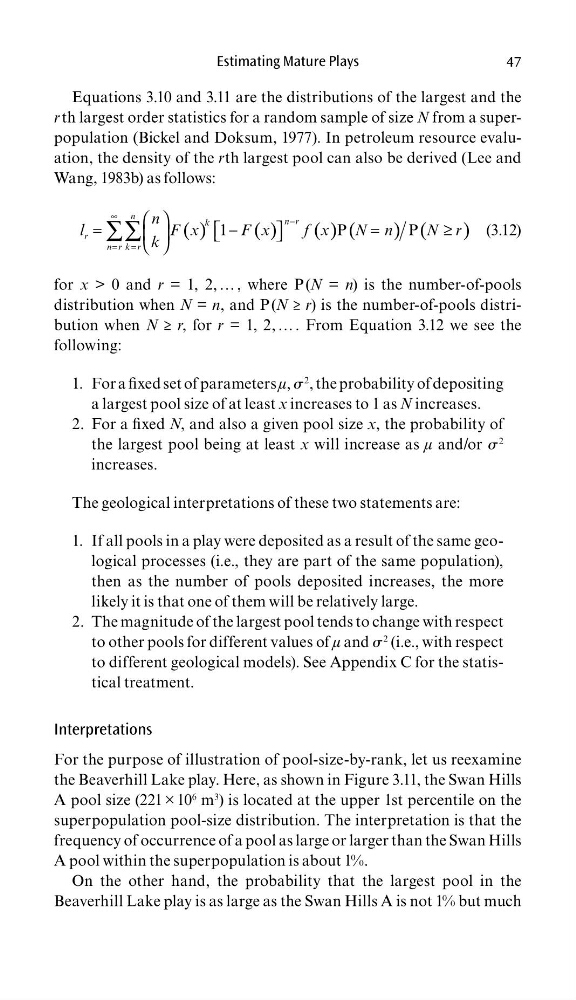
Equations 3.10 and 3.11 are the distributions of the largest and the
r th largest order statistics for a random sample of size N from a superpopulation (Bickel and Doksum, 1977). In petroleum resource evaluation, the density of the rth largest pool can also be derived (Lee and
Wang, 1983b) as follows:
( )
( )
( ) (
) (
)
∞
−
=
=
=
−
=
≥
∑∑
1
P
P
n
n r
k
r
n r k r
n
l
F x
F x
f x
N n
N r
k
(3.12)
for x > 0 and r = 1, 2, … , where P (N = n) is the number-of-pools
distribution when N = n, and P (N ≥ r) is the number-of-pools distribution when N ≥ r, for r = 1, 2, … . From Equation 3.12 we see the
following:
For a fi xed set of parameters
1.
μ, σ
2 , the probability of depositing
a largest pool size of at least x increases to 1 as N increases.
For a fi xed
2.
N, and also a given pool size x, the probability of
the largest pool being at least x will increase as μ and/or σ
2
increases.
The geological interpretations of these two statements are:
If all pools in a play were deposited as a result of the same geo1.
logical processes (i.e., they are part of the same population),
then as the number of pools deposited increases, the more
likely it is that one of them will be relatively large.
The magnitude of the largest pool tends to change with respect
2.
to other pools for different values of μ and σ
2 (i.e., with respect
to different geological models). See Appendix C for the statistical treatment.
Interpretations
For the purpose of illustration of pool-size-by-rank, let us reexamine
the Beaverhill Lake play. Here, as shown in Figure 3.11, the Swan Hills
A pool size (221 × 10
6 m
3
) is located at the upper 1st percentile on the
superpopulation pool-size distribution. The interpretation is that the
frequency of occurrence of a pool as large or larger than the Swan Hills
A pool within the superpopulation is about 1%.
On the other hand, the probability that the largest pool in the
Beaverhill Lake play is as large as the Swan Hills A is not 1% but much
47
Equations 3.10 and 3.11 are the distributions of the largest and the
r th largest order statistics for a random sample of size N from a superpopulation (Bickel and Doksum, 1977). In petroleum resource evaluation, the density of the rth largest pool can also be derived (Lee and
Wang, 1983b) as follows:
( )
( )
( ) (
) (
)
∞
−
=
=
=
−
=
≥
∑∑
1
P
P
n
n r
k
r
n r k r
n
l
F x
F x
f x
N n
N r
k
(3.12)
for x > 0 and r = 1, 2, … , where P (N = n) is the number-of-pools
distribution when N = n, and P (N ≥ r) is the number-of-pools distribution when N ≥ r, for r = 1, 2, … . From Equation 3.12 we see the
following:
For a fi xed set of parameters
1.
μ, σ
2 , the probability of depositing
a largest pool size of at least x increases to 1 as N increases.
For a fi xed
2.
N, and also a given pool size x, the probability of
the largest pool being at least x will increase as μ and/or σ
2
increases.
The geological interpretations of these two statements are:
If all pools in a play were deposited as a result of the same geo1.
logical processes (i.e., they are part of the same population),
then as the number of pools deposited increases, the more
likely it is that one of them will be relatively large.
The magnitude of the largest pool tends to change with respect
2.
to other pools for different values of μ and σ
2 (i.e., with respect
to different geological models). See Appendix C for the statistical treatment.
Interpretations
For the purpose of illustration of pool-size-by-rank, let us reexamine
the Beaverhill Lake play. Here, as shown in Figure 3.11, the Swan Hills
A pool size (221 × 10
6 m
3
) is located at the upper 1st percentile on the
superpopulation pool-size distribution. The interpretation is that the
frequency of occurrence of a pool as large or larger than the Swan Hills
A pool within the superpopulation is about 1%.
On the other hand, the probability that the largest pool in the
Beaverhill Lake play is as large as the Swan Hills A is not 1% but much