

44
Statistical Methods for Estimating Petroleum Resources
Canada Sedimentary Basin consists of oil and gas within a single
reservoir. This example is ideal for demonstrating the application of
Equation 3.9 for estimating the bivariate lognormal distribution for
both oil and gas deposits.
The estimated mean matrix and covariance matrix for the natural logarithms of gas and oil volumes are ˆ = (4.695, − 2.560) and
=
⌺
7.155 5.973
ˆ
5.973 5.752
respectively. The bivariate lognormal distribution for
both gas and oil is
(
)
(
)
(
)
(
)
=
−
−
×
×
×
×
× −
− −
− −
−
−
−
+
×
×
2
2
1
1
gas, oil
exp
2 1 0.867
gas oil 2
2.675 2.398
1 0.867
oil
2.560
oil
2.560
gas 4.695
gas 4.695
2 0.931
2.675
2.675
2.398
2.398
f
p
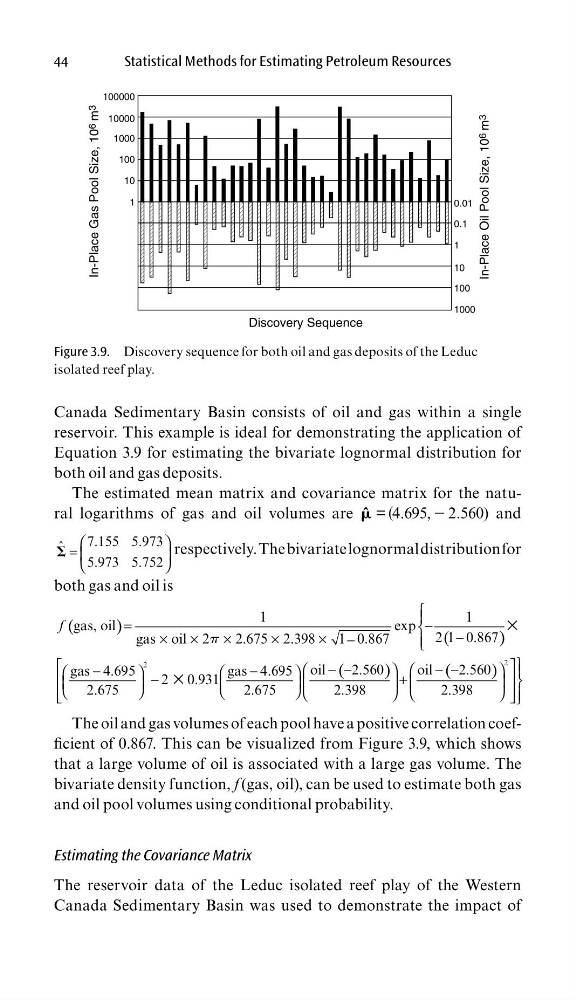
The oil and gas volumes of each pool have a positive correlation coeffi cient of 0.867. This can be visualized from Figure 3.9, which shows
that a large volume of oil is associated with a large gas volume. The
bivariate density function, f (gas, oil), can be used to estimate both gas
and oil pool volumes using conditional probability.
Estimating the Covariance Matrix
The reservoir data of the Leduc isolated reef play of the Western
Canada Sedimentary Basin was used to demonstrate the impact of
100000
10000
1000
100
10
1
0.01
0.1
1
10
100
1000
Discovery Sequence
In-Place Oil Pool Size, 10 6
m 3
In-Place Gas Pool Size, 10 6
m 3
Figure 3.9. Discovery sequence for both oil and gas deposits of the Leduc
isolated reef play.
Statistical Methods for Estimating Petroleum Resources
Canada Sedimentary Basin consists of oil and gas within a single
reservoir. This example is ideal for demonstrating the application of
Equation 3.9 for estimating the bivariate lognormal distribution for
both oil and gas deposits.
The estimated mean matrix and covariance matrix for the natural logarithms of gas and oil volumes are ˆ = (4.695, − 2.560) and
=
⌺
7.155 5.973
ˆ
5.973 5.752
respectively. The bivariate lognormal distribution for
both gas and oil is
(
)
(
)
(
)
(
)
=
−
−
×
×
×
×
× −
− −
− −
−
−
−
+
×
×
2
2
1
1
gas, oil
exp
2 1 0.867
gas oil 2
2.675 2.398
1 0.867
oil
2.560
oil
2.560
gas 4.695
gas 4.695
2 0.931
2.675
2.675
2.398
2.398
f
p
The oil and gas volumes of each pool have a positive correlation coeffi cient of 0.867. This can be visualized from Figure 3.9, which shows
that a large volume of oil is associated with a large gas volume. The
bivariate density function, f (gas, oil), can be used to estimate both gas
and oil pool volumes using conditional probability.
Estimating the Covariance Matrix
The reservoir data of the Leduc isolated reef play of the Western
Canada Sedimentary Basin was used to demonstrate the impact of
100000
10000
1000
100
10
1
0.01
0.1
1
10
100
1000
Discovery Sequence
In-Place Oil Pool Size, 10 6
m 3
In-Place Gas Pool Size, 10 6
m 3
Figure 3.9. Discovery sequence for both oil and gas deposits of the Leduc
isolated reef play.