

Evaluating Conceptual Plays
133
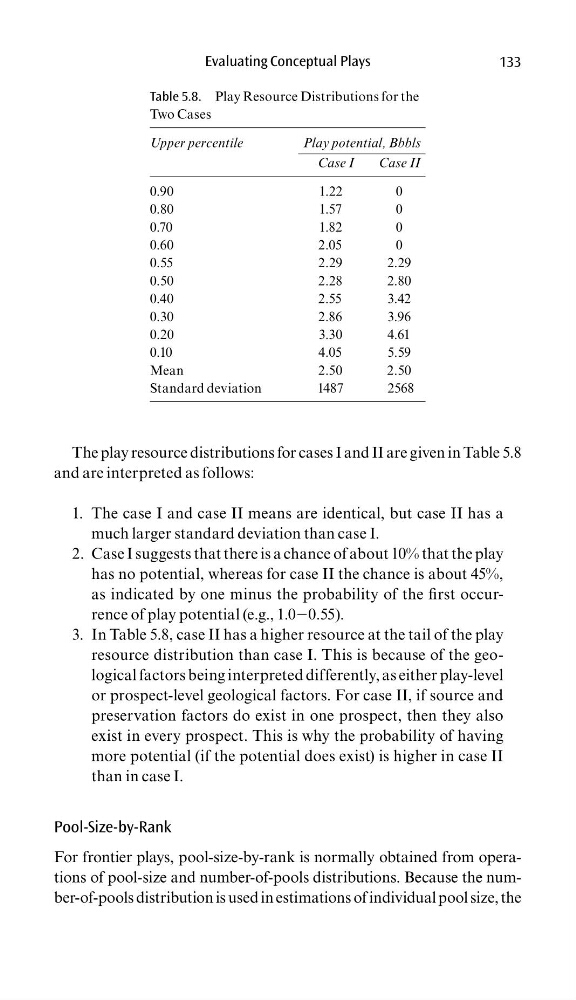
The play resource distributions for cases I and II are given in Table 5.8
and are interpreted as follows:
The case I and case II means are identical, but case II has a
1.
much larger standard deviation than case I.
Case I suggests that there is a chance of about 10% that the play
2.
has no potential, whereas for case II the chance is about 45%,
as indicated by one minus the probability of the fi rst occurrence of play potential (e.g., 1.020.55).
In Table 5.8, case II has a higher resource at the tail of the play
3.
resource distribution than case I. This is because of the geological factors being interpreted differently, as either play-level
or prospect-level geological factors. For case II, if source and
preservation factors do exist in one prospect, then they also
exist in every prospect. This is why the probability of having
more potential (if the potential does exist) is higher in case II
than in case I.
Pool-Size-by-Rank
For frontier plays, pool-size-by-rank is normally obtained from operations of pool-size and number-of-pools distributions. Because the number-of-pools distribution is used in estimations of individual pool size, the
Table 5.8. Play Resource Distributions for the
Two Cases
Upper percentile
Play potential, Bbbls
Case I
Case II
0.90
1.22
0
0.80
1.57
0
0.70
1.82
0
0.60
2.05
0
0.55
2.29
2.29
0.50
2.28
2.80
0.40
2.55
3.42
0.30
2.86
3.96
0.20
3.30
4.61
0.10
4.05
5.59
Mean
2.50
2.50
Standard deviation
1487
2568
133
The play resource distributions for cases I and II are given in Table 5.8
and are interpreted as follows:
The case I and case II means are identical, but case II has a
1.
much larger standard deviation than case I.
Case I suggests that there is a chance of about 10% that the play
2.
has no potential, whereas for case II the chance is about 45%,
as indicated by one minus the probability of the fi rst occurrence of play potential (e.g., 1.020.55).
In Table 5.8, case II has a higher resource at the tail of the play
3.
resource distribution than case I. This is because of the geological factors being interpreted differently, as either play-level
or prospect-level geological factors. For case II, if source and
preservation factors do exist in one prospect, then they also
exist in every prospect. This is why the probability of having
more potential (if the potential does exist) is higher in case II
than in case I.
Pool-Size-by-Rank
For frontier plays, pool-size-by-rank is normally obtained from operations of pool-size and number-of-pools distributions. Because the number-of-pools distribution is used in estimations of individual pool size, the
Table 5.8. Play Resource Distributions for the
Two Cases
Upper percentile
Play potential, Bbbls
Case I
Case II
0.90
1.22
0
0.80
1.57
0
0.70
1.82
0
0.60
2.05
0
0.55
2.29
2.29
0.50
2.28
2.80
0.40
2.55
3.42
0.30
2.86
3.96
0.20
3.30
4.61
0.10
4.05
5.59
Mean
2.50
2.50
Standard deviation
1487
2568