

More about Discovery Process Models
101
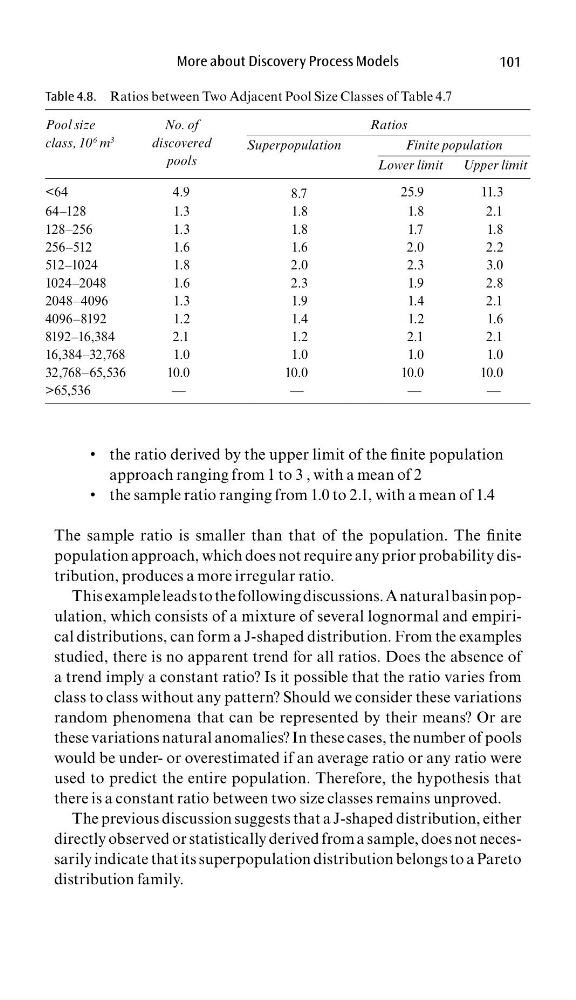
• the ratio derived by the upper limit of the fi nite population
approach ranging from 1 to 3 , with a mean of 2
• the sample ratio ranging from 1.0 to 2.1, with a mean of 1.4
The sample ratio is smaller than that of the population. The fi nite
population approach, which does not require any prior probability distribution, produces a more irregular ratio.
This example leads to the following discussions. A natural basin population, which consists of a mixture of several lognormal and empirical distributions, can form a J-shaped distribution. From the examples
studied, there is no apparent trend for all ratios. Does the absence of
a trend imply a constant ratio? Is it possible that the ratio varies from
class to class without any pattern? Should we consider these variations
random phenomena that can be represented by their means? Or are
these variations natural anomalies? In these cases, the number of pools
would be under- or overestimated if an average ratio or any ratio were
used to predict the entire population. Therefore, the hypothesis that
there is a constant ratio between two size classes remains unproved.
The previous discussion suggests that a J-shaped distribution, either
directly observed or statistically derived from a sample, does not necessarily indicate that its superpopulation distribution belongs to a Pareto
distribution family.
Table 4.8. Ratios between Two Adjacent Pool Size Classes of Table 4.7
Pool size
class, 10
6 m
3
No. of
discovered
pools
Ratios
Superpopulation
Finite population
Lower limit Upper limit
<64
4.9
8.7
25.9
11.3
64–128
1.3
1.8
1.8
2.1
128–256
1.3
1.8
1.7
1.8
256–512
1.6
1.6
2.0
2.2
512–1024
1.8
2.0
2.3
3.0
1024–2048
1.6
2.3
1.9
2.8
2048–4096
1.3
1.9
1.4
2.1
4096–8192
1.2
1.4
1.2
1.6
8192–16,384
2.1
1.2
2.1
2.1
16,384–32,768
1.0
1.0
1.0
1.0
32,768–65,536
10.0
10.0
10.0
10.0
>65,536
—
—
—
—
101
• the ratio derived by the upper limit of the fi nite population
approach ranging from 1 to 3 , with a mean of 2
• the sample ratio ranging from 1.0 to 2.1, with a mean of 1.4
The sample ratio is smaller than that of the population. The fi nite
population approach, which does not require any prior probability distribution, produces a more irregular ratio.
This example leads to the following discussions. A natural basin population, which consists of a mixture of several lognormal and empirical distributions, can form a J-shaped distribution. From the examples
studied, there is no apparent trend for all ratios. Does the absence of
a trend imply a constant ratio? Is it possible that the ratio varies from
class to class without any pattern? Should we consider these variations
random phenomena that can be represented by their means? Or are
these variations natural anomalies? In these cases, the number of pools
would be under- or overestimated if an average ratio or any ratio were
used to predict the entire population. Therefore, the hypothesis that
there is a constant ratio between two size classes remains unproved.
The previous discussion suggests that a J-shaped distribution, either
directly observed or statistically derived from a sample, does not necessarily indicate that its superpopulation distribution belongs to a Pareto
distribution family.
Table 4.8. Ratios between Two Adjacent Pool Size Classes of Table 4.7
Pool size
class, 10
6 m
3
No. of
discovered
pools
Ratios
Superpopulation
Finite population
Lower limit Upper limit
<64
4.9
8.7
25.9
11.3
64–128
1.3
1.8
1.8
2.1
128–256
1.3
1.8
1.7
1.8
256–512
1.6
1.6
2.0
2.2
512–1024
1.8
2.0
2.3
3.0
1024–2048
1.6
2.3
1.9
2.8
2048–4096
1.3
1.9
1.4
2.1
4096–8192
1.2
1.4
1.2
1.6
8192–16,384
2.1
1.2
2.1
2.1
16,384–32,768
1.0
1.0
1.0
1.0
32,768–65,536
10.0
10.0
10.0
10.0
>65,536
—
—
—
—