

100
Statistical Methods for Estimating Petroleum Resources
Pool-Size Distribution of a Basin
Observations from 25 Devonian plays (Reinson et al., 1993) with different means and variances of lognormal and empirical distributions
have been considered as a single population. For the superpopulation
case, each play was evaluated using LDSCV or NDSCV. For the fi nite
population case (the maximum-likelihood function of the fi nite population approach is based on the work by Bickel et al. [1992]), all pool
sizes were combined into one single population with a size class of base
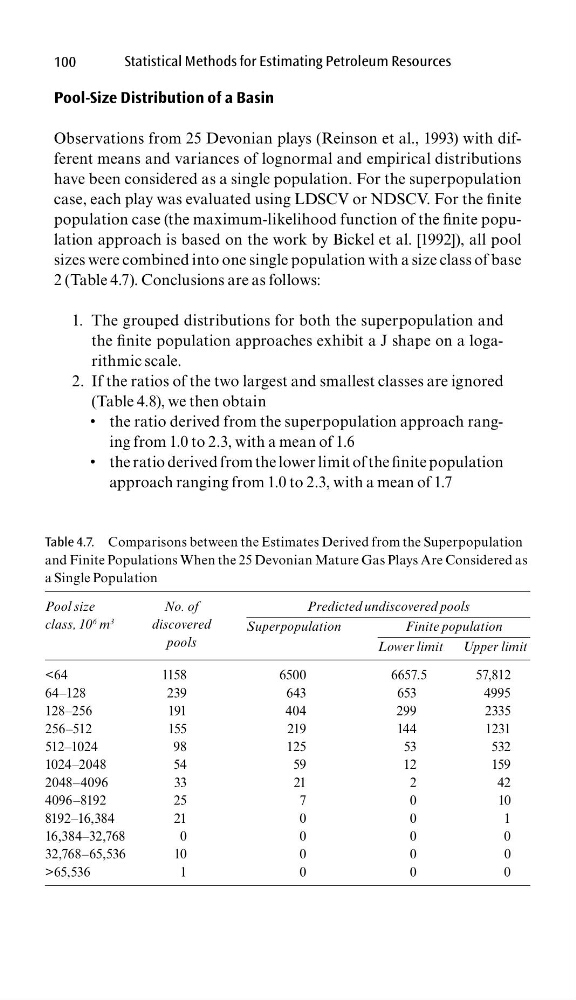
2 (Table 4.7). Conclusions are as follows:
The grouped distributions for both the superpopulation and
1.
the fi nite population approaches exhibit a J shape on a logarithmic scale.
If the ratios of the two largest and smallest classes are ignored
2.
(Table 4.8), we then obtain
• the ratio derived from the superpopulation approach ranging from 1.0 to 2.3, with a mean of 1.6
• the ratio derived from the lower limit of the fi nite population
approach ranging from 1.0 to 2.3, with a mean of 1.7
Table 4.7. Comparisons between the Estimates Derived from the Superpopulation
and Finite Populations When the 25 Devonian Mature Gas Plays Are Considered as
a Single Population
Pool size
class, 10
6 m
3
No. of
discovered
pools
Predicted undiscovered pools
Superpopulation
Finite population
Lower limit Upper limit
<64
1158
6500
6657.5
57,812
64–128
239
643
653
4995
128–256
191
404
299
2335
256–512
155
219
144
1231
512–1024
98
125
53
532
1024–2048
54
59
12
159
2048–4096
33
21
2
42
4096–8192
25
7
0
10
8192–16,384
21
0
0
1
16,384–32,768
0
0
0
0
32,768–65,536
10
0
0
0
>65,536
1
0
0
0
Statistical Methods for Estimating Petroleum Resources
Pool-Size Distribution of a Basin
Observations from 25 Devonian plays (Reinson et al., 1993) with different means and variances of lognormal and empirical distributions
have been considered as a single population. For the superpopulation
case, each play was evaluated using LDSCV or NDSCV. For the fi nite
population case (the maximum-likelihood function of the fi nite population approach is based on the work by Bickel et al. [1992]), all pool
sizes were combined into one single population with a size class of base
2 (Table 4.7). Conclusions are as follows:
The grouped distributions for both the superpopulation and
1.
the fi nite population approaches exhibit a J shape on a logarithmic scale.
If the ratios of the two largest and smallest classes are ignored
2.
(Table 4.8), we then obtain
• the ratio derived from the superpopulation approach ranging from 1.0 to 2.3, with a mean of 1.6
• the ratio derived from the lower limit of the fi nite population
approach ranging from 1.0 to 2.3, with a mean of 1.7
Table 4.7. Comparisons between the Estimates Derived from the Superpopulation
and Finite Populations When the 25 Devonian Mature Gas Plays Are Considered as
a Single Population
Pool size
class, 10
6 m
3
No. of
discovered
pools
Predicted undiscovered pools
Superpopulation
Finite population
Lower limit Upper limit
<64
1158
6500
6657.5
57,812
64–128
239
643
653
4995
128–256
191
404
299
2335
256–512
155
219
144
1231
512–1024
98
125
53
532
1024–2048
54
59
12
159
2048–4096
33
21
2
42
4096–8192
25
7
0
10
8192–16,384
21
0
0
1
16,384–32,768
0
0
0
0
32,768–65,536
10
0
0
0
>65,536
1
0
0
0