

68
X. Li et al.
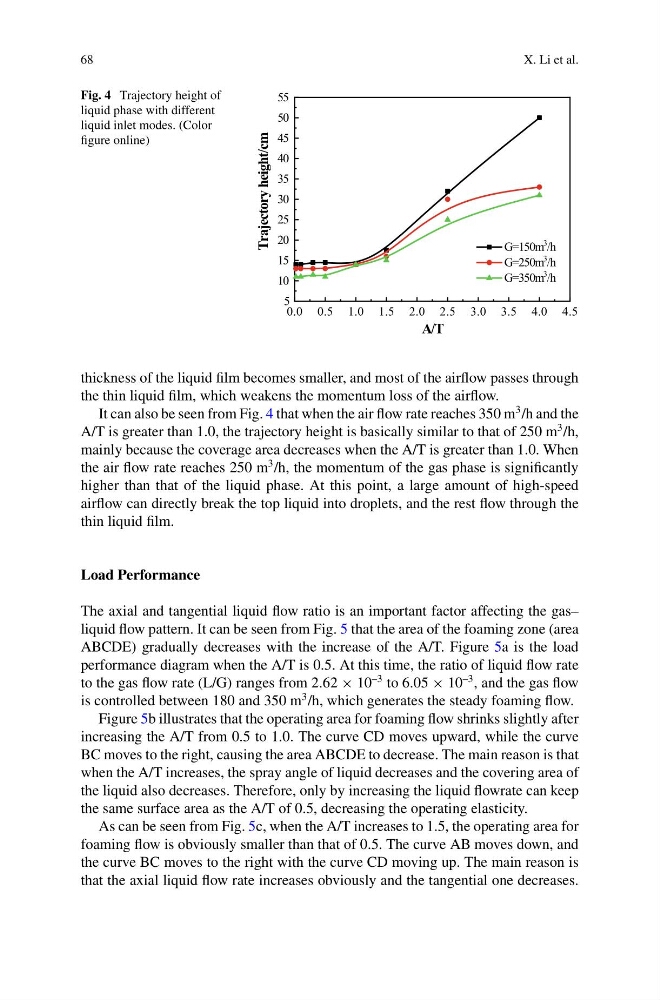
Fig. 4 Trajectory height of
liquid phase with different
liquid inlet modes. (Color
figure online)
0.0 0.5 1.0 1.5 2.0 2.5 3.0 3.5 4.0 4.5
5
10
15
20
25
30
35
40
45
50
55
A/T
G=150m
3
/h
G=250m
3
/h
G=350m
3
/h
Trajectory height/cm
thickness of the liquid film becomes smaller, and most of the airflow passes through
the thin liquid film, which weakens the momentum loss of the airflow.
It can also be seen from Fig. 4 that when the air flow rate reaches 350 m
3 /h and the
A/T is greater than 1.0, the trajectory height is basically similar to that of 250 m
3 /h,
mainly because the coverage area decreases when the A/T is greater than 1.0. When
the air flow rate reaches 250 m
3 /h, the momentum of the gas phase is significantly
higher than that of the liquid phase. At this point, a large amount of high-speed
airflow can directly break the top liquid into droplets, and the rest flow through the
thin liquid film.
Load Performance
The axial and tangential liquid flow ratio is an important factor affecting the gas–
liquid flow pattern. It can be seen from Fig. 5 that the area of the foaming zone (area
ABCDE) gradually decreases with the increase of the A/T. Figure 5a is the load
performance diagram when the A/T is 0.5. At this time, the ratio of liquid flow rate
to the gas flow rate (L/G) ranges from 2.62 × 10
–3 to 6.05 × 10
–3 , and the gas flow
is controlled between 180 and 350 m
3 /h, which generates the steady foaming flow.
Figure 5b illustrates that the operating area for foaming flow shrinks slightly after
increasing the A/T from 0.5 to 1.0. The curve CD moves upward, while the curve
BC moves to the right, causing the area ABCDE to decrease. The main reason is that
when the A/T increases, the spray angle of liquid decreases and the covering area of
the liquid also decreases. Therefore, only by increasing the liquid flowrate can keep
the same surface area as the A/T of 0.5, decreasing the operating elasticity.
As can be seen from Fig. 5c, when the A/T increases to 1.5, the operating area for
foaming flow is obviously smaller than that of 0.5. The curve AB moves down, and
the curve BC moves to the right with the curve CD moving up. The main reason is
that the axial liquid flow rate increases obviously and the tangential one decreases.
X. Li et al.
Fig. 4 Trajectory height of
liquid phase with different
liquid inlet modes. (Color
figure online)
0.0 0.5 1.0 1.5 2.0 2.5 3.0 3.5 4.0 4.5
5
10
15
20
25
30
35
40
45
50
55
A/T
G=150m
3
/h
G=250m
3
/h
G=350m
3
/h
Trajectory height/cm
thickness of the liquid film becomes smaller, and most of the airflow passes through
the thin liquid film, which weakens the momentum loss of the airflow.
It can also be seen from Fig. 4 that when the air flow rate reaches 350 m
3 /h and the
A/T is greater than 1.0, the trajectory height is basically similar to that of 250 m
3 /h,
mainly because the coverage area decreases when the A/T is greater than 1.0. When
the air flow rate reaches 250 m
3 /h, the momentum of the gas phase is significantly
higher than that of the liquid phase. At this point, a large amount of high-speed
airflow can directly break the top liquid into droplets, and the rest flow through the
thin liquid film.
Load Performance
The axial and tangential liquid flow ratio is an important factor affecting the gas–
liquid flow pattern. It can be seen from Fig. 5 that the area of the foaming zone (area
ABCDE) gradually decreases with the increase of the A/T. Figure 5a is the load
performance diagram when the A/T is 0.5. At this time, the ratio of liquid flow rate
to the gas flow rate (L/G) ranges from 2.62 × 10
–3 to 6.05 × 10
–3 , and the gas flow
is controlled between 180 and 350 m
3 /h, which generates the steady foaming flow.
Figure 5b illustrates that the operating area for foaming flow shrinks slightly after
increasing the A/T from 0.5 to 1.0. The curve CD moves upward, while the curve
BC moves to the right, causing the area ABCDE to decrease. The main reason is that
when the A/T increases, the spray angle of liquid decreases and the covering area of
the liquid also decreases. Therefore, only by increasing the liquid flowrate can keep
the same surface area as the A/T of 0.5, decreasing the operating elasticity.
As can be seen from Fig. 5c, when the A/T increases to 1.5, the operating area for
foaming flow is obviously smaller than that of 0.5. The curve AB moves down, and
the curve BC moves to the right with the curve CD moving up. The main reason is
that the axial liquid flow rate increases obviously and the tangential one decreases.