

114
K. He et al.
In this study, the crystalline phases, morphological, and internal structure of reduction products were examined by X-ray diffraction (XRD, D/Max2500pc, Rigaku),
SEM/EDS (TESCAN VEGA 3 LMH SEM), and optical microscope (Axioskop 40,
Carl Zeiss).
Analysis Method
Generally, the data obtained from MS need to be further addressed. Wang et al. [19]
suggested that the dimensionless conversion X of solid reactant in MFBRA under
the isothermal conditions can be defined as the ratio of oxygen loss at time t (W t ) to
the total oxygen content of solid reactant (W ∞ ) [25], which can be expressed as
X =
W t
W ∞
=
t
t 0
(I − I t 0 )dt
t ∞
t 0
(I − I t 0 )dt
(1)
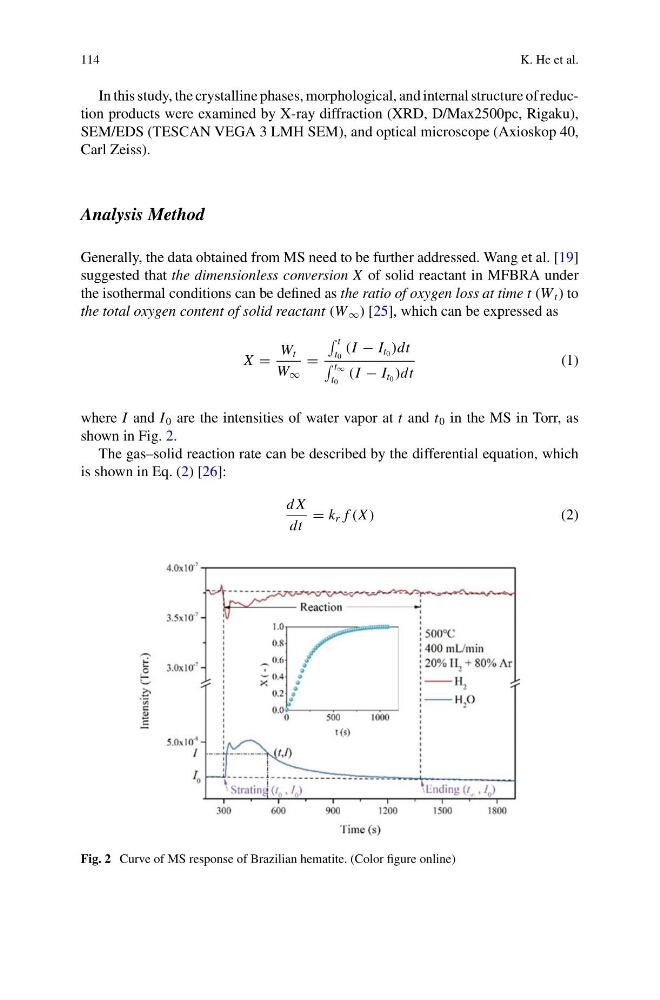
where I and I 0 are the intensities of water vapor at t and t 0 in the MS in Torr, as
shown in Fig. 2.
The gas–solid reaction rate can be described by the differential equation, which
is shown in Eq. (2) [26]:
d X
dt
= k r f (X )
(2)
Fig. 2 Curve of MS response of Brazilian hematite. (Color figure online)
K. He et al.
In this study, the crystalline phases, morphological, and internal structure of reduction products were examined by X-ray diffraction (XRD, D/Max2500pc, Rigaku),
SEM/EDS (TESCAN VEGA 3 LMH SEM), and optical microscope (Axioskop 40,
Carl Zeiss).
Analysis Method
Generally, the data obtained from MS need to be further addressed. Wang et al. [19]
suggested that the dimensionless conversion X of solid reactant in MFBRA under
the isothermal conditions can be defined as the ratio of oxygen loss at time t (W t ) to
the total oxygen content of solid reactant (W ∞ ) [25], which can be expressed as
X =
W t
W ∞
=
t
t 0
(I − I t 0 )dt
t ∞
t 0
(I − I t 0 )dt
(1)
where I and I 0 are the intensities of water vapor at t and t 0 in the MS in Torr, as
shown in Fig. 2.
The gas–solid reaction rate can be described by the differential equation, which
is shown in Eq. (2) [26]:
d X
dt
= k r f (X )
(2)
Fig. 2 Curve of MS response of Brazilian hematite. (Color figure online)