

106
Z. Liu et al.
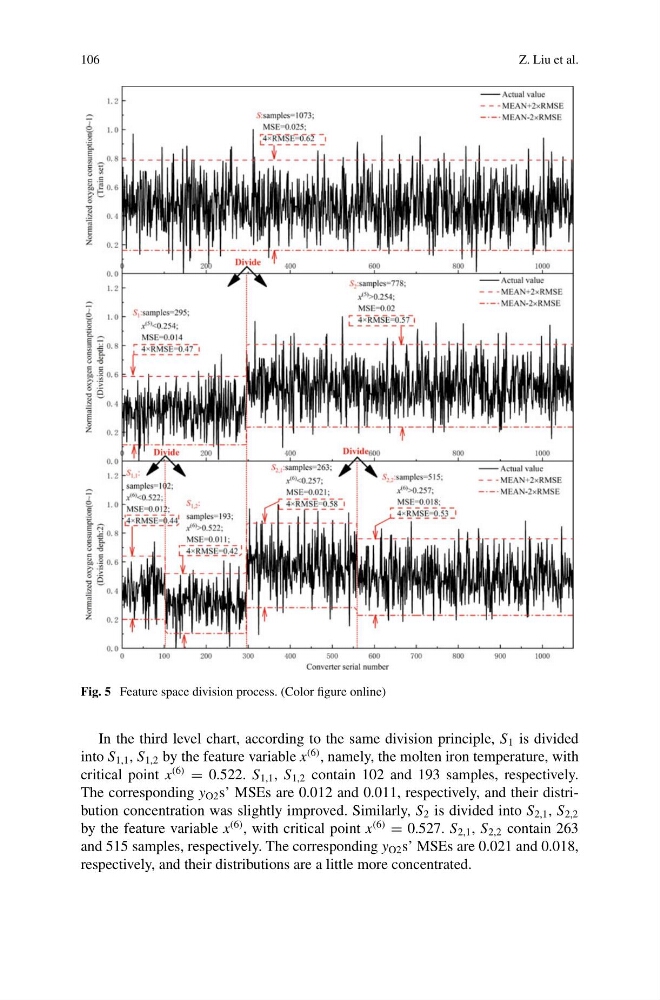
Fig. 5 Feature space division process. (Color figure online)
In the third level chart, according to the same division principle, S 1 is divided
into S 1,1 , S 1,2 by the feature variable x
(6) , namely, the molten iron temperature, with
critical point x
(6)
= 0.522. S 1,1 , S 1,2 contain 102 and 193 samples, respectively.
The corresponding y O2 s’ MSEs are 0.012 and 0.011, respectively, and their distribution concentration was slightly improved. Similarly, S 2 is divided into S 2,1 , S 2,2
by the feature variable x
(6) , with critical point x
(6)
= 0.527. S 2,1 , S 2,2 contain 263
and 515 samples, respectively. The corresponding y O2 s’ MSEs are 0.021 and 0.018,
respectively, and their distributions are a little more concentrated.
Z. Liu et al.
Fig. 5 Feature space division process. (Color figure online)
In the third level chart, according to the same division principle, S 1 is divided
into S 1,1 , S 1,2 by the feature variable x
(6) , namely, the molten iron temperature, with
critical point x
(6)
= 0.522. S 1,1 , S 1,2 contain 102 and 193 samples, respectively.
The corresponding y O2 s’ MSEs are 0.012 and 0.011, respectively, and their distribution concentration was slightly improved. Similarly, S 2 is divided into S 2,1 , S 2,2
by the feature variable x
(6) , with critical point x
(6)
= 0.527. S 2,1 , S 2,2 contain 263
and 515 samples, respectively. The corresponding y O2 s’ MSEs are 0.021 and 0.018,
respectively, and their distributions are a little more concentrated.