

104
Z. Liu et al.
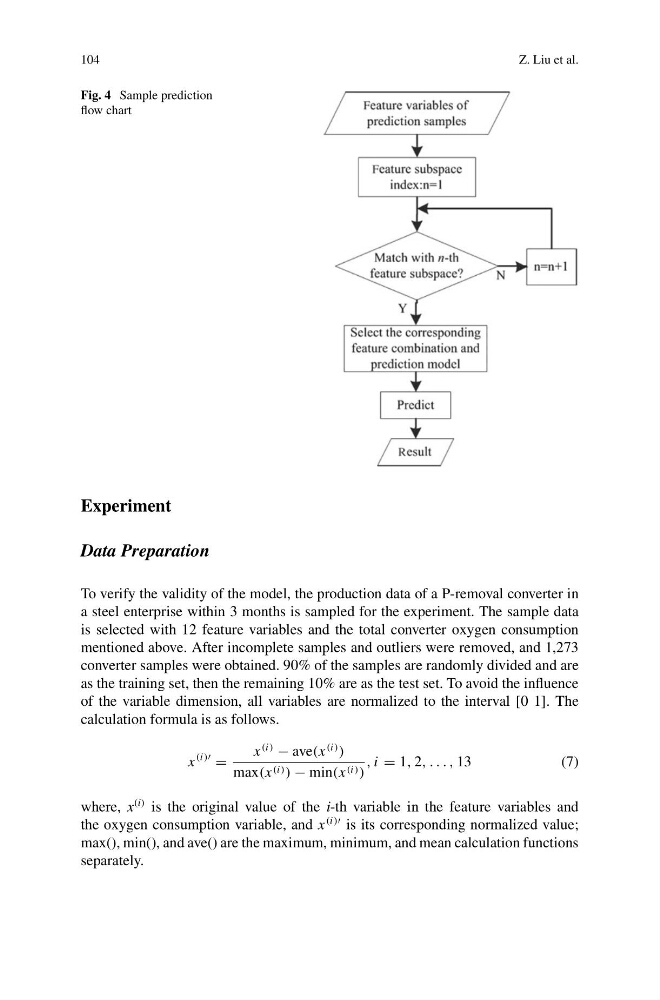
Fig. 4 Sample prediction
flow chart
Experiment
Data Preparation
To verify the validity of the model, the production data of a P-removal converter in
a steel enterprise within 3 months is sampled for the experiment. The sample data
is selected with 12 feature variables and the total converter oxygen consumption
mentioned above. After incomplete samples and outliers were removed, and 1,273
converter samples were obtained. 90% of the samples are randomly divided and are
as the training set, then the remaining 10% are as the test set. To avoid the influence
of the variable dimension, all variables are normalized to the interval [0 1]. The
calculation formula is as follows.
x
(i)
=
x
(i)
− ave(x
(i)
)
max(x (i) ) − min(x (i) )
, i = 1, 2, . . . , 13
(7)
where, x
(i) is the original value of the i-th variable in the feature variables and
the oxygen consumption variable, and x
(i) is its corresponding normalized value;
max(), min(), and ave() are the maximum, minimum, and mean calculation functions
separately.
Z. Liu et al.
Fig. 4 Sample prediction
flow chart
Experiment
Data Preparation
To verify the validity of the model, the production data of a P-removal converter in
a steel enterprise within 3 months is sampled for the experiment. The sample data
is selected with 12 feature variables and the total converter oxygen consumption
mentioned above. After incomplete samples and outliers were removed, and 1,273
converter samples were obtained. 90% of the samples are randomly divided and are
as the training set, then the remaining 10% are as the test set. To avoid the influence
of the variable dimension, all variables are normalized to the interval [0 1]. The
calculation formula is as follows.
x
(i)
=
x
(i)
− ave(x
(i)
)
max(x (i) ) − min(x (i) )
, i = 1, 2, . . . , 13
(7)
where, x
(i) is the original value of the i-th variable in the feature variables and
the oxygen consumption variable, and x
(i) is its corresponding normalized value;
max(), min(), and ave() are the maximum, minimum, and mean calculation functions
separately.