

6.1 Presentation of the Practical Area of Application
161
according to Teiwes et al. [Te+2018] to reliable results. The LPC has also been
tested with different machines data for this work to simplify the extraction of
machine-state-based load profiles from large datasets. It has become evident that
the results of the clustering were only clearly separated according to the machine
states, if the power values of the machine states significantly differed in the height
of their values.
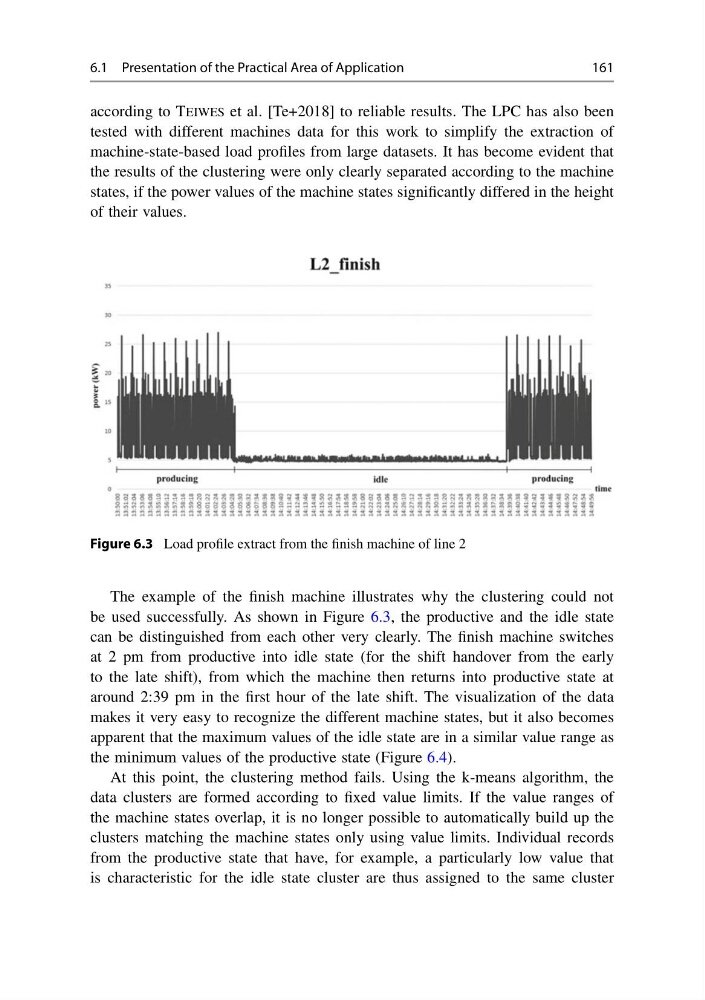
Figure 6.3 Load profile extract from the finish machine of line 2
The example of the finish machine illustrates why the clustering could not
be used successfully. As shown in Figure 6.3, the productive and the idle state
can be distinguished from each other very clearly. The finish machine switches
at 2 pm from productive into idle state (for the shift handover from the early
to the late shift), from which the machine then returns into productive state at
around 2:39 pm in the first hour of the late shift. The visualization of the data
makes it very easy to recognize the different machine states, but it also becomes
apparent that the maximum values of the idle state are in a similar value range as
the minimum values of the productive state (Figure 6.4).
At this point, the clustering method fails. Using the k-means algorithm, the
data clusters are formed according to fixed value limits. If the value ranges of
the machine states overlap, it is no longer possible to automatically build up the
clusters matching the machine states only using value limits. Individual records
from the productive state that have, for example, a particularly low value that
is characteristic for the idle state cluster are thus assigned to the same cluster
161
according to Teiwes et al. [Te+2018] to reliable results. The LPC has also been
tested with different machines data for this work to simplify the extraction of
machine-state-based load profiles from large datasets. It has become evident that
the results of the clustering were only clearly separated according to the machine
states, if the power values of the machine states significantly differed in the height
of their values.
Figure 6.3 Load profile extract from the finish machine of line 2
The example of the finish machine illustrates why the clustering could not
be used successfully. As shown in Figure 6.3, the productive and the idle state
can be distinguished from each other very clearly. The finish machine switches
at 2 pm from productive into idle state (for the shift handover from the early
to the late shift), from which the machine then returns into productive state at
around 2:39 pm in the first hour of the late shift. The visualization of the data
makes it very easy to recognize the different machine states, but it also becomes
apparent that the maximum values of the idle state are in a similar value range as
the minimum values of the productive state (Figure 6.4).
At this point, the clustering method fails. Using the k-means algorithm, the
data clusters are formed according to fixed value limits. If the value ranges of
the machine states overlap, it is no longer possible to automatically build up the
clusters matching the machine states only using value limits. Individual records
from the productive state that have, for example, a particularly low value that
is characteristic for the idle state cluster are thus assigned to the same cluster