

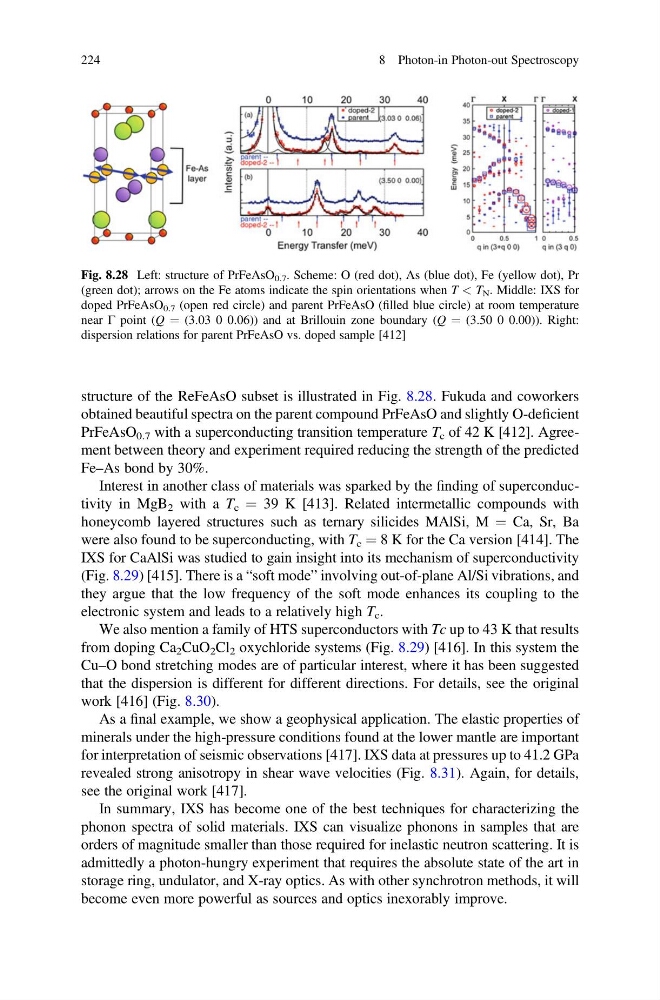
structure of the ReFeAsO subset is illustrated in Fig. 8.28. Fukuda and coworkers
obtained beautiful spectra on the parent compound PrFeAsO and slightly O-deficient
PrFeAsO 0.7 with a superconducting transition temperature T c of 42 K [412]. Agreement between theory and experiment required reducing the strength of the predicted
Fe–As bond by 30%.
Interest in another class of materials was sparked by the finding of superconductivity in MgB 2 with a T c ¼ 39 K [413]. Related intermetallic compounds with
honeycomb layered structures such as ternary silicides MAlSi, M ¼ Ca, Sr, Ba
were also found to be superconducting, with T c ¼ 8 K for the Ca version [414]. The
IXS for CaAlSi was studied to gain insight into its mechanism of superconductivity
(Fig. 8.29) [415]. There is a “soft mode” involving out-of-plane Al/Si vibrations, and
they argue that the low frequency of the soft mode enhances its coupling to the
electronic system and leads to a relatively high T c .
We also mention a family of HTS superconductors with Tc up to 43 K that results
from doping Ca 2 CuO 2 Cl 2 oxychloride systems (Fig. 8.29) [416]. In this system the
Cu–O bond stretching modes are of particular interest, where it has been suggested
that the dispersion is different for different directions. For details, see the original
work [416] (Fig. 8.30).
As a final example, we show a geophysical application. The elastic properties of
minerals under the high-pressure conditions found at the lower mantle are important
for interpretation of seismic observations [417]. IXS data at pressures up to 41.2 GPa
revealed strong anisotropy in shear wave velocities (Fig. 8.31). Again, for details,
see the original work [417].
In summary, IXS has become one of the best techniques for characterizing the
phonon spectra of solid materials. IXS can visualize phonons in samples that are
orders of magnitude smaller than those required for inelastic neutron scattering. It is
admittedly a photon-hungry experiment that requires the absolute state of the art in
storage ring, undulator, and X-ray optics. As with other synchrotron methods, it will
become even more powerful as sources and optics inexorably improve.
Fig. 8.28 Left: structure of PrFeAsO 0.7 . Scheme: O (red dot), As (blue dot), Fe (yellow dot), Pr
(green dot); arrows on the Fe atoms indicate the spin orientations when T < T N . Middle: IXS for
doped PrFeAsO 0.7 (open red circle) and parent PrFeAsO (filled blue circle) at room temperature
near Γ point (Q ¼ (3.03 0 0.06)) and at Brillouin zone boundary (Q ¼ (3.50 0 0.00)). Right:
dispersion relations for parent PrFeAsO vs. doped sample [412]
224
8 Photon-in Photon-out Spectroscopy
obtained beautiful spectra on the parent compound PrFeAsO and slightly O-deficient
PrFeAsO 0.7 with a superconducting transition temperature T c of 42 K [412]. Agreement between theory and experiment required reducing the strength of the predicted
Fe–As bond by 30%.
Interest in another class of materials was sparked by the finding of superconductivity in MgB 2 with a T c ¼ 39 K [413]. Related intermetallic compounds with
honeycomb layered structures such as ternary silicides MAlSi, M ¼ Ca, Sr, Ba
were also found to be superconducting, with T c ¼ 8 K for the Ca version [414]. The
IXS for CaAlSi was studied to gain insight into its mechanism of superconductivity
(Fig. 8.29) [415]. There is a “soft mode” involving out-of-plane Al/Si vibrations, and
they argue that the low frequency of the soft mode enhances its coupling to the
electronic system and leads to a relatively high T c .
We also mention a family of HTS superconductors with Tc up to 43 K that results
from doping Ca 2 CuO 2 Cl 2 oxychloride systems (Fig. 8.29) [416]. In this system the
Cu–O bond stretching modes are of particular interest, where it has been suggested
that the dispersion is different for different directions. For details, see the original
work [416] (Fig. 8.30).
As a final example, we show a geophysical application. The elastic properties of
minerals under the high-pressure conditions found at the lower mantle are important
for interpretation of seismic observations [417]. IXS data at pressures up to 41.2 GPa
revealed strong anisotropy in shear wave velocities (Fig. 8.31). Again, for details,
see the original work [417].
In summary, IXS has become one of the best techniques for characterizing the
phonon spectra of solid materials. IXS can visualize phonons in samples that are
orders of magnitude smaller than those required for inelastic neutron scattering. It is
admittedly a photon-hungry experiment that requires the absolute state of the art in
storage ring, undulator, and X-ray optics. As with other synchrotron methods, it will
become even more powerful as sources and optics inexorably improve.
Fig. 8.28 Left: structure of PrFeAsO 0.7 . Scheme: O (red dot), As (blue dot), Fe (yellow dot), Pr
(green dot); arrows on the Fe atoms indicate the spin orientations when T < T N . Middle: IXS for
doped PrFeAsO 0.7 (open red circle) and parent PrFeAsO (filled blue circle) at room temperature
near Γ point (Q ¼ (3.03 0 0.06)) and at Brillouin zone boundary (Q ¼ (3.50 0 0.00)). Right:
dispersion relations for parent PrFeAsO vs. doped sample [412]
224
8 Photon-in Photon-out Spectroscopy