

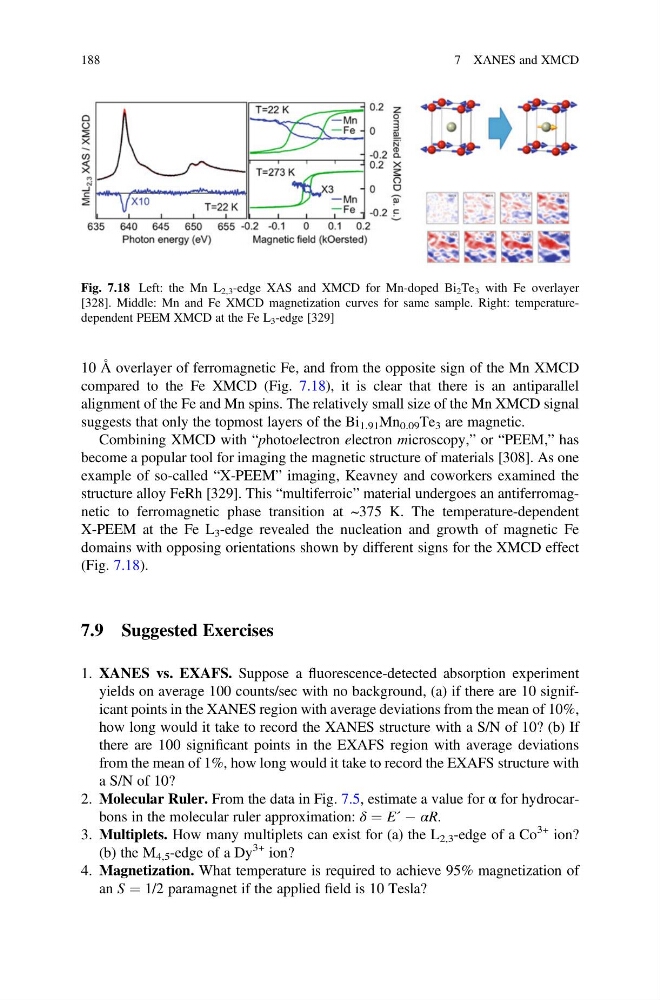
10 Å overlayer of ferromagnetic Fe, and from the opposite sign of the Mn XMCD
compared to the Fe XMCD (Fig. 7.18), it is clear that there is an antiparallel
alignment of the Fe and Mn spins. The relatively small size of the Mn XMCD signal
suggests that only the topmost layers of the Bi 1.91 Mn 0.09 Te 3 are magnetic.
Combining XMCD with “photoelectron electron microscopy,” or “PEEM,” has
become a popular tool for imaging the magnetic structure of materials [308]. As one
example of so-called “X-PEEM” imaging, Keavney and coworkers examined the
structure alloy FeRh [329]. This “multiferroic” material undergoes an antiferromagnetic to ferromagnetic phase transition at ~375 K. The temperature-dependent
X-PEEM at the Fe L 3 -edge revealed the nucleation and growth of magnetic Fe
domains with opposing orientations shown by different signs for the XMCD effect
(Fig. 7.18).
7.9 Suggested Exercises
1. XANES vs. EXAFS. Suppose a fluorescence-detected absorption experiment
yields on average 100 counts/sec with no background, (a) if there are 10 significant points in the XANES region with average deviations from the mean of 10%,
how long would it take to record the XANES structure with a S/N of 10? (b) If
there are 100 significant points in the EXAFS region with average deviations
from the mean of 1%, how long would it take to record the EXAFS structure with
a S/N of 10?
2. Molecular Ruler. From the data in Fig. 7.5, estimate a value for α for hydrocarbons in the molecular ruler approximation: δ ¼ E´ À αR.
3. Multiplets. How many multiplets can exist for (a) the L 2,3 -edge of a Co
3+ ion?
(b) the M 4,5 -edge of a Dy
3+ ion?
4. Magnetization. What temperature is required to achieve 95% magnetization of
an S ¼ 1/2 paramagnet if the applied field is 10 Tesla?
Fig. 7.18 Left: the Mn L 2,3 -edge XAS and XMCD for Mn-doped Bi 2 Te 3 with Fe overlayer
[328]. Middle: Mn and Fe XMCD magnetization curves for same sample. Right: temperaturedependent PEEM XMCD at the Fe L 3 -edge [329]
188
7 XANES and XMCD
compared to the Fe XMCD (Fig. 7.18), it is clear that there is an antiparallel
alignment of the Fe and Mn spins. The relatively small size of the Mn XMCD signal
suggests that only the topmost layers of the Bi 1.91 Mn 0.09 Te 3 are magnetic.
Combining XMCD with “photoelectron electron microscopy,” or “PEEM,” has
become a popular tool for imaging the magnetic structure of materials [308]. As one
example of so-called “X-PEEM” imaging, Keavney and coworkers examined the
structure alloy FeRh [329]. This “multiferroic” material undergoes an antiferromagnetic to ferromagnetic phase transition at ~375 K. The temperature-dependent
X-PEEM at the Fe L 3 -edge revealed the nucleation and growth of magnetic Fe
domains with opposing orientations shown by different signs for the XMCD effect
(Fig. 7.18).
7.9 Suggested Exercises
1. XANES vs. EXAFS. Suppose a fluorescence-detected absorption experiment
yields on average 100 counts/sec with no background, (a) if there are 10 significant points in the XANES region with average deviations from the mean of 10%,
how long would it take to record the XANES structure with a S/N of 10? (b) If
there are 100 significant points in the EXAFS region with average deviations
from the mean of 1%, how long would it take to record the EXAFS structure with
a S/N of 10?
2. Molecular Ruler. From the data in Fig. 7.5, estimate a value for α for hydrocarbons in the molecular ruler approximation: δ ¼ E´ À αR.
3. Multiplets. How many multiplets can exist for (a) the L 2,3 -edge of a Co
3+ ion?
(b) the M 4,5 -edge of a Dy
3+ ion?
4. Magnetization. What temperature is required to achieve 95% magnetization of
an S ¼ 1/2 paramagnet if the applied field is 10 Tesla?
Fig. 7.18 Left: the Mn L 2,3 -edge XAS and XMCD for Mn-doped Bi 2 Te 3 with Fe overlayer
[328]. Middle: Mn and Fe XMCD magnetization curves for same sample. Right: temperaturedependent PEEM XMCD at the Fe L 3 -edge [329]
188
7 XANES and XMCD