

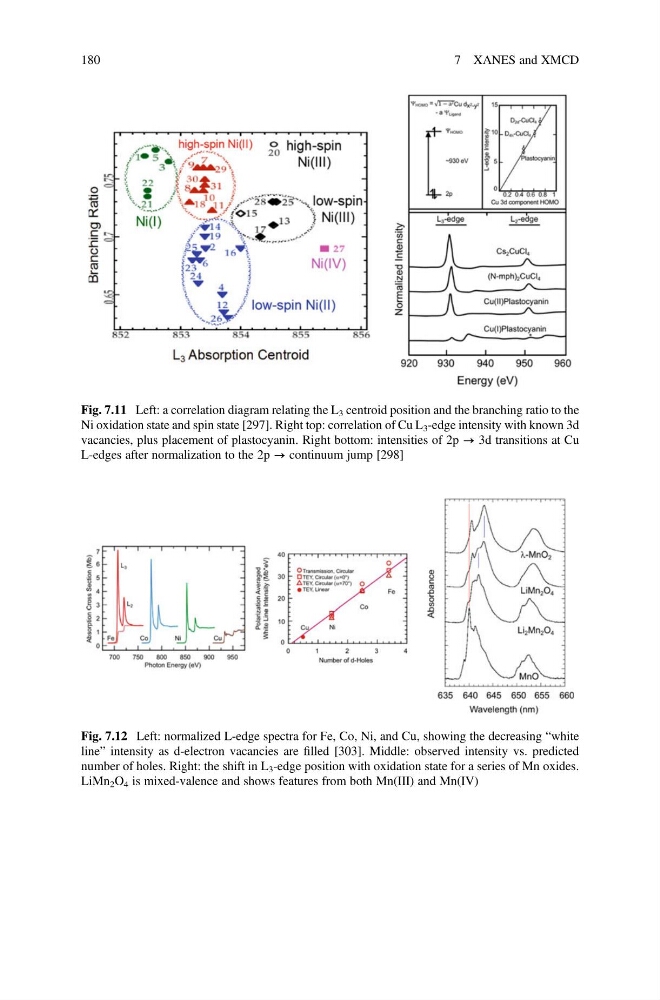
Fig. 7.11 Left: a correlation diagram relating the L 3 centroid position and the branching ratio to the
Ni oxidation state and spin state [297]. Right top: correlation of Cu L 3 -edge intensity with known 3d
vacancies, plus placement of plastocyanin. Right bottom: intensities of 2p → 3d transitions at Cu
L-edges after normalization to the 2p → continuum jump [298]
Fig. 7.12 Left: normalized L-edge spectra for Fe, Co, Ni, and Cu, showing the decreasing “white
line” intensity as d-electron vacancies are filled [303]. Middle: observed intensity vs. predicted
number of holes. Right: the shift in L 3 -edge position with oxidation state for a series of Mn oxides.
LiMn 2 O 4 is mixed-valence and shows features from both Mn(III) and Mn(IV)
180
7 XANES and XMCD
Ni oxidation state and spin state [297]. Right top: correlation of Cu L 3 -edge intensity with known 3d
vacancies, plus placement of plastocyanin. Right bottom: intensities of 2p → 3d transitions at Cu
L-edges after normalization to the 2p → continuum jump [298]
Fig. 7.12 Left: normalized L-edge spectra for Fe, Co, Ni, and Cu, showing the decreasing “white
line” intensity as d-electron vacancies are filled [303]. Middle: observed intensity vs. predicted
number of holes. Right: the shift in L 3 -edge position with oxidation state for a series of Mn oxides.
LiMn 2 O 4 is mixed-valence and shows features from both Mn(III) and Mn(IV)
180
7 XANES and XMCD