

7.1 Some Motivation
The absorption edge region is orders of magnitude easier to record than an EXAFS
spectrum. First of all, the range is much smaller, perhaps 50 eV instead of
500–1000 eV, so there are fewer points to cover. Furthermore, the magnitude of
the features is much larger, with structure sometimes as large as the edge jump itself,
as opposed to EXAFS modulations of ~<1%. Compared to EXAFS analysis,
interpretation can also be easy. The XANES region is rich in effects that can be
used for chemical information. These include:
• Chemical shifts in the position of edge features.
• Intensity variation that depends on densities of states and selection rules.
• Vibrational fine structure.
• Linear dichroism.
• Magnetic circular dichroism.
• “Natural” circular dichroism.
7.2 Empirical XANES Interpretation
The application of XANES can in many cases be done using empirical trends from
standard compounds, which often provide a fingerprint for certain species. Although
some might call this scientific “stamp-collecting” mode, in many such cases, this is
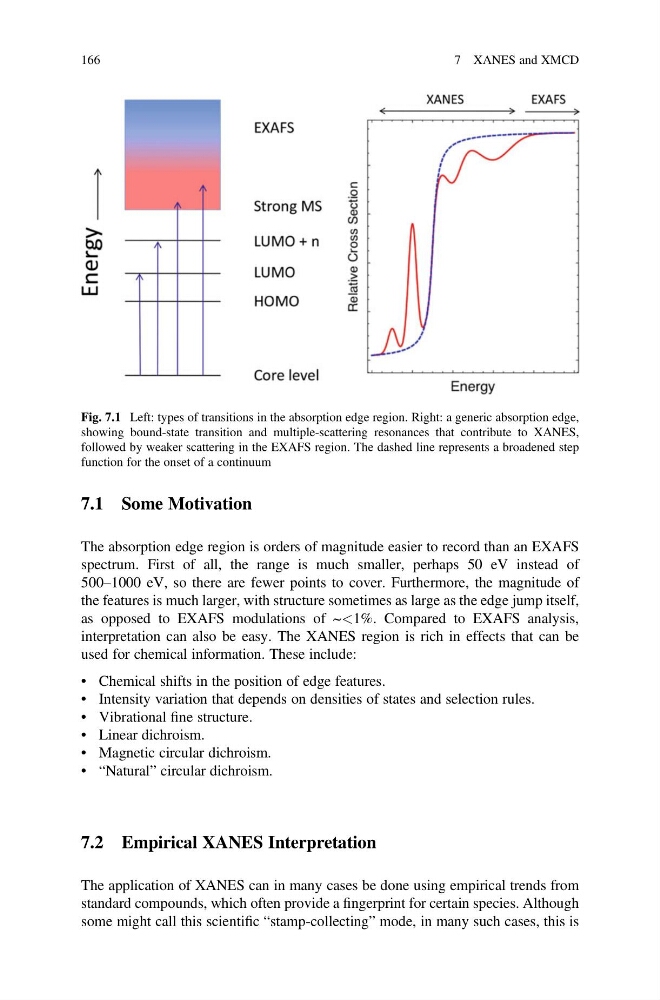
Fig. 7.1 Left: types of transitions in the absorption edge region. Right: a generic absorption edge,
showing bound-state transition and multiple-scattering resonances that contribute to XANES,
followed by weaker scattering in the EXAFS region. The dashed line represents a broadened step
function for the onset of a continuum
166
7 XANES and XMCD
The absorption edge region is orders of magnitude easier to record than an EXAFS
spectrum. First of all, the range is much smaller, perhaps 50 eV instead of
500–1000 eV, so there are fewer points to cover. Furthermore, the magnitude of
the features is much larger, with structure sometimes as large as the edge jump itself,
as opposed to EXAFS modulations of ~<1%. Compared to EXAFS analysis,
interpretation can also be easy. The XANES region is rich in effects that can be
used for chemical information. These include:
• Chemical shifts in the position of edge features.
• Intensity variation that depends on densities of states and selection rules.
• Vibrational fine structure.
• Linear dichroism.
• Magnetic circular dichroism.
• “Natural” circular dichroism.
7.2 Empirical XANES Interpretation
The application of XANES can in many cases be done using empirical trends from
standard compounds, which often provide a fingerprint for certain species. Although
some might call this scientific “stamp-collecting” mode, in many such cases, this is
Fig. 7.1 Left: types of transitions in the absorption edge region. Right: a generic absorption edge,
showing bound-state transition and multiple-scattering resonances that contribute to XANES,
followed by weaker scattering in the EXAFS region. The dashed line represents a broadened step
function for the onset of a continuum
166
7 XANES and XMCD