

6.6.2 EXAFS Extraction
The next step is to extract the oscillatory part from the total absorption for that
particular element and edge. Although various single polynomials and more complex functions have been tried, it is rarely the case that a single function works well
over the entire data range. A poor background subtraction results in low-frequency
artifacts in the EXAFS spectrum. Experience has shown that cubic splines or related
piecewise polynomials do an adequate job. A calculated spline is overlaid with the
pre-edge subtracted data in (Fig. 6.17). The gory details are covered in articles by
Stern and Bunker [244] and the cited reference books.
Since EXAFS is define as the modulation of the absorbance (μ(Ε) À μ 0 (E))/
μ 0 (E) ¼ Δμ(Ε)/μ 0 (E), one has to normalize the amplitude of the oscillations relative
to the smooth atomic absorption. Near the edge itself, say at a particular energy E 1 ,
μ 0 can be seen as the value of the interpolating spline. At higher energies, the
extrapolated pre-edge subtraction often results in an unreliable estimate of μ 0 .
Instead, it is safer to record μ 0 close to E 0 and rely again on the Victoreen function
in the post-edge region to estimate the denominator as:
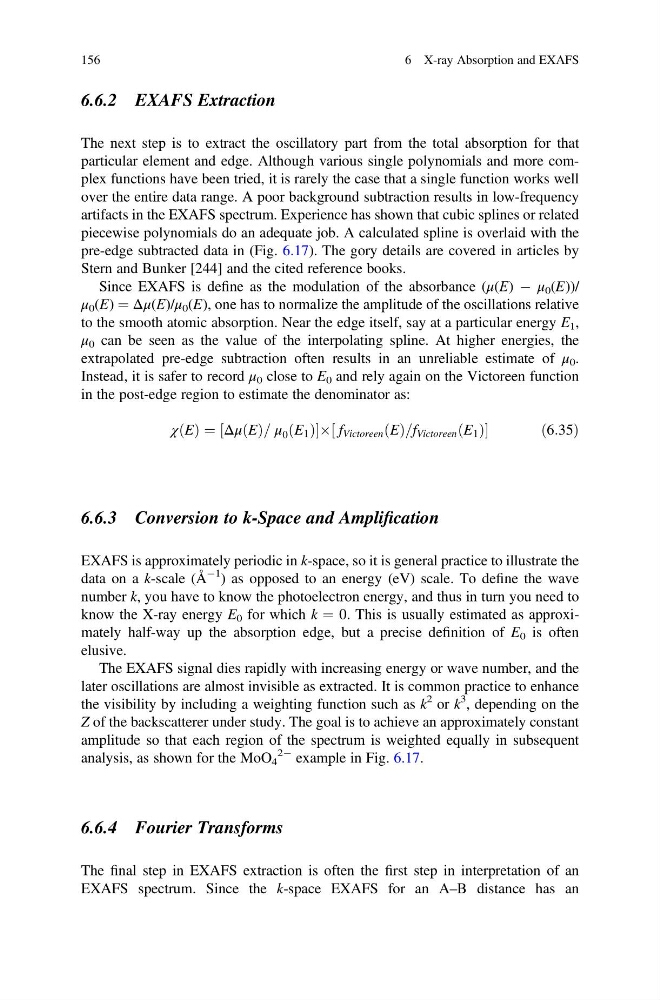
χ E
ð Þ ¼ ½Δμ E
ð Þ= μ 0 E 1
ð Þ½ f Victoreen E
ð Þ=f Victoreen E 1
ð Þ
ð6:35Þ
6.6.3 Conversion to k-Space and Amplification
EXAFS is approximately periodic in k-space, so it is general practice to illustrate the
data on a k-scale (Å
À1 ) as opposed to an energy (eV) scale. To define the wave
number k, you have to know the photoelectron energy, and thus in turn you need to
know the X-ray energy E 0 for which k ¼ 0. This is usually estimated as approximately half-way up the absorption edge, but a precise definition of E 0 is often
elusive.
The EXAFS signal dies rapidly with increasing energy or wave number, and the
later oscillations are almost invisible as extracted. It is common practice to enhance
the visibility by including a weighting function such as k
2 or k
3 , depending on the
Z of the backscatterer under study. The goal is to achieve an approximately constant
amplitude so that each region of the spectrum is weighted equally in subsequent
analysis, as shown for the MoO 4
2À example in Fig. 6.17.
6.6.4 Fourier Transforms
The final step in EXAFS extraction is often the first step in interpretation of an
EXAFS spectrum. Since the k-space EXAFS for an A–B distance has an
156
6 X-ray Absorption and EXAFS
The next step is to extract the oscillatory part from the total absorption for that
particular element and edge. Although various single polynomials and more complex functions have been tried, it is rarely the case that a single function works well
over the entire data range. A poor background subtraction results in low-frequency
artifacts in the EXAFS spectrum. Experience has shown that cubic splines or related
piecewise polynomials do an adequate job. A calculated spline is overlaid with the
pre-edge subtracted data in (Fig. 6.17). The gory details are covered in articles by
Stern and Bunker [244] and the cited reference books.
Since EXAFS is define as the modulation of the absorbance (μ(Ε) À μ 0 (E))/
μ 0 (E) ¼ Δμ(Ε)/μ 0 (E), one has to normalize the amplitude of the oscillations relative
to the smooth atomic absorption. Near the edge itself, say at a particular energy E 1 ,
μ 0 can be seen as the value of the interpolating spline. At higher energies, the
extrapolated pre-edge subtraction often results in an unreliable estimate of μ 0 .
Instead, it is safer to record μ 0 close to E 0 and rely again on the Victoreen function
in the post-edge region to estimate the denominator as:
χ E
ð Þ ¼ ½Δμ E
ð Þ= μ 0 E 1
ð Þ½ f Victoreen E
ð Þ=f Victoreen E 1
ð Þ
ð6:35Þ
6.6.3 Conversion to k-Space and Amplification
EXAFS is approximately periodic in k-space, so it is general practice to illustrate the
data on a k-scale (Å
À1 ) as opposed to an energy (eV) scale. To define the wave
number k, you have to know the photoelectron energy, and thus in turn you need to
know the X-ray energy E 0 for which k ¼ 0. This is usually estimated as approximately half-way up the absorption edge, but a precise definition of E 0 is often
elusive.
The EXAFS signal dies rapidly with increasing energy or wave number, and the
later oscillations are almost invisible as extracted. It is common practice to enhance
the visibility by including a weighting function such as k
2 or k
3 , depending on the
Z of the backscatterer under study. The goal is to achieve an approximately constant
amplitude so that each region of the spectrum is weighted equally in subsequent
analysis, as shown for the MoO 4
2À example in Fig. 6.17.
6.6.4 Fourier Transforms
The final step in EXAFS extraction is often the first step in interpretation of an
EXAFS spectrum. Since the k-space EXAFS for an A–B distance has an
156
6 X-ray Absorption and EXAFS