

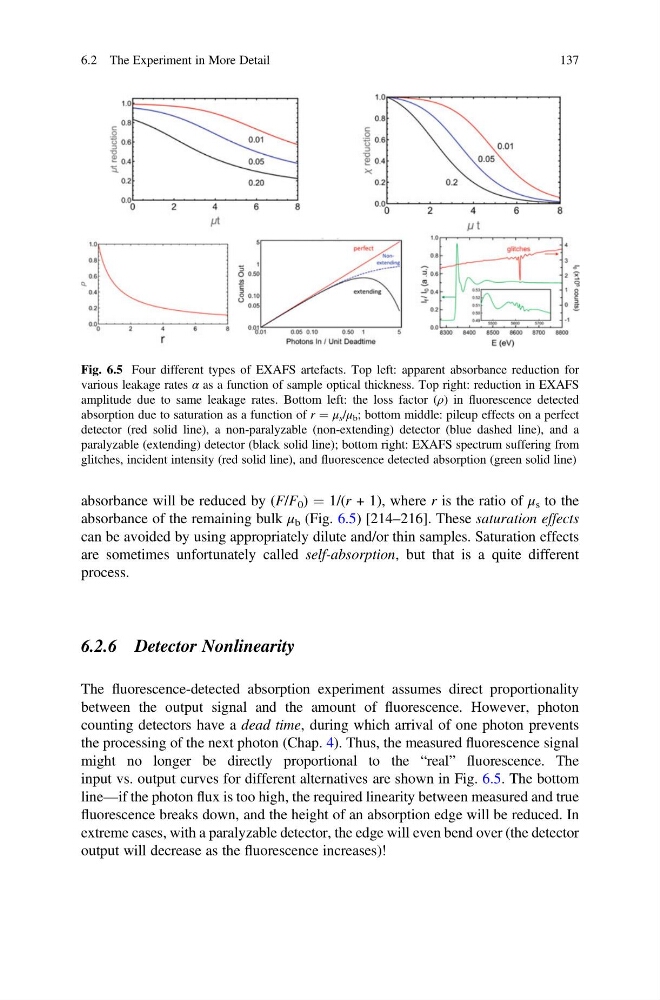
absorbance will be reduced by (F/F 0 ) ¼ 1/(r + 1), where r is the ratio of μ s to the
absorbance of the remaining bulk μ b (Fig. 6.5) [214–216]. These saturation effects
can be avoided by using appropriately dilute and/or thin samples. Saturation effects
are sometimes unfortunately called self-absorption, but that is a quite different
process.
6.2.6 Detector Nonlinearity
The fluorescence-detected absorption experiment assumes direct proportionality
between the output signal and the amount of fluorescence. However, photon
counting detectors have a dead time, during which arrival of one photon prevents
the processing of the next photon (Chap. 4). Thus, the measured fluorescence signal
might no longer be directly proportional to the “real” fluorescence. The
input vs. output curves for different alternatives are shown in Fig. 6.5. The bottom
line—if the photon flux is too high, the required linearity between measured and true
fluorescence breaks down, and the height of an absorption edge will be reduced. In
extreme cases, with a paralyzable detector, the edge will even bend over (the detector
output will decrease as the fluorescence increases)!
Fig. 6.5 Four different types of EXAFS artefacts. Top left: apparent absorbance reduction for
various leakage rates α as a function of sample optical thickness. Top right: reduction in EXAFS
amplitude due to same leakage rates. Bottom left: the loss factor (ρ) in fluorescence detected
absorption due to saturation as a function of r ¼ μ s /μ b ; bottom middle: pileup effects on a perfect
detector (red solid line), a non-paralyzable (non-extending) detector (blue dashed line), and a
paralyzable (extending) detector (black solid line); bottom right: EXAFS spectrum suffering from
glitches, incident intensity (red solid line), and fluorescence detected absorption (green solid line)
6.2 The Experiment in More Detail
137
absorbance of the remaining bulk μ b (Fig. 6.5) [214–216]. These saturation effects
can be avoided by using appropriately dilute and/or thin samples. Saturation effects
are sometimes unfortunately called self-absorption, but that is a quite different
process.
6.2.6 Detector Nonlinearity
The fluorescence-detected absorption experiment assumes direct proportionality
between the output signal and the amount of fluorescence. However, photon
counting detectors have a dead time, during which arrival of one photon prevents
the processing of the next photon (Chap. 4). Thus, the measured fluorescence signal
might no longer be directly proportional to the “real” fluorescence. The
input vs. output curves for different alternatives are shown in Fig. 6.5. The bottom
line—if the photon flux is too high, the required linearity between measured and true
fluorescence breaks down, and the height of an absorption edge will be reduced. In
extreme cases, with a paralyzable detector, the edge will even bend over (the detector
output will decrease as the fluorescence increases)!
Fig. 6.5 Four different types of EXAFS artefacts. Top left: apparent absorbance reduction for
various leakage rates α as a function of sample optical thickness. Top right: reduction in EXAFS
amplitude due to same leakage rates. Bottom left: the loss factor (ρ) in fluorescence detected
absorption due to saturation as a function of r ¼ μ s /μ b ; bottom middle: pileup effects on a perfect
detector (red solid line), a non-paralyzable (non-extending) detector (blue dashed line), and a
paralyzable (extending) detector (black solid line); bottom right: EXAFS spectrum suffering from
glitches, incident intensity (red solid line), and fluorescence detected absorption (green solid line)
6.2 The Experiment in More Detail
137