

For a perfectly parallel incident beam, the angular range Δθ D over which diffraction occurs is called the angular Darwin width (ω D ). Furthermore, from the Bragg
equation, the resolution of a single crystal X-ray monochromator can be expressed
as:
ΔE=E ¼ Δλ=λ ¼ cot θΔθ
ð4:28Þ
The final energy resolution will depend on a Δθ that is the geometric sum of the
beam divergence on the crystal and the angular Darwin width ω D .
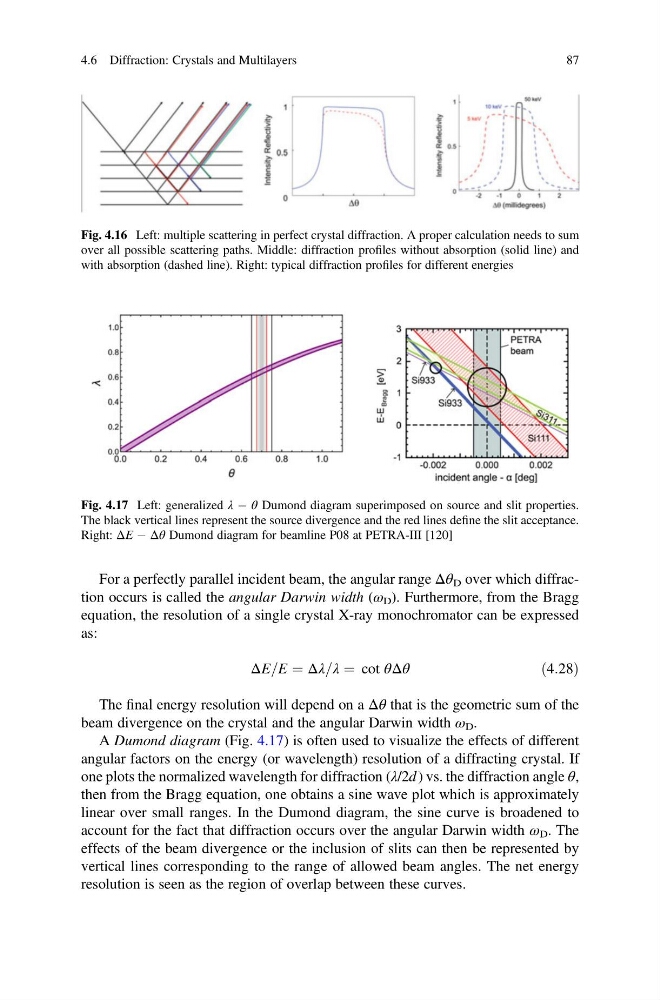
A Dumond diagram (Fig. 4.17) is often used to visualize the effects of different
angular factors on the energy (or wavelength) resolution of a diffracting crystal. If
one plots the normalized wavelength for diffraction (λ/2d ) vs. the diffraction angle θ,
then from the Bragg equation, one obtains a sine wave plot which is approximately
linear over small ranges. In the Dumond diagram, the sine curve is broadened to
account for the fact that diffraction occurs over the angular Darwin width ω D . The
effects of the beam divergence or the inclusion of slits can then be represented by
vertical lines corresponding to the range of allowed beam angles. The net energy
resolution is seen as the region of overlap between these curves.
Fig. 4.16 Left: multiple scattering in perfect crystal diffraction. A proper calculation needs to sum
over all possible scattering paths. Middle: diffraction profiles without absorption (solid line) and
with absorption (dashed line). Right: typical diffraction profiles for different energies
Fig. 4.17 Left: generalized λ À θ Dumond diagram superimposed on source and slit properties.
The black vertical lines represent the source divergence and the red lines define the slit acceptance.
Right: ΔE À Δθ Dumond diagram for beamline P08 at PETRA-III [120]
4.6 Diffraction: Crystals and Multilayers
87
equation, the resolution of a single crystal X-ray monochromator can be expressed
as:
ΔE=E ¼ Δλ=λ ¼ cot θΔθ
ð4:28Þ
The final energy resolution will depend on a Δθ that is the geometric sum of the
beam divergence on the crystal and the angular Darwin width ω D .
A Dumond diagram (Fig. 4.17) is often used to visualize the effects of different
angular factors on the energy (or wavelength) resolution of a diffracting crystal. If
one plots the normalized wavelength for diffraction (λ/2d ) vs. the diffraction angle θ,
then from the Bragg equation, one obtains a sine wave plot which is approximately
linear over small ranges. In the Dumond diagram, the sine curve is broadened to
account for the fact that diffraction occurs over the angular Darwin width ω D . The
effects of the beam divergence or the inclusion of slits can then be represented by
vertical lines corresponding to the range of allowed beam angles. The net energy
resolution is seen as the region of overlap between these curves.
Fig. 4.16 Left: multiple scattering in perfect crystal diffraction. A proper calculation needs to sum
over all possible scattering paths. Middle: diffraction profiles without absorption (solid line) and
with absorption (dashed line). Right: typical diffraction profiles for different energies
Fig. 4.17 Left: generalized λ À θ Dumond diagram superimposed on source and slit properties.
The black vertical lines represent the source divergence and the red lines define the slit acceptance.
Right: ΔE À Δθ Dumond diagram for beamline P08 at PETRA-III [120]
4.6 Diffraction: Crystals and Multilayers
87