

14.3.3 Interactions of Detergents vs. Amphipols with Membrane Proteins
as Probed by Mass Spectrometry
In Study 14.8, the interaction of detergent (DDM) and APol (A8-35) with a model MP, OmpT, was
examined using fast photochemical oxidation of proteins (FPOP) followed by tryptic digestion and
MS-MS sequencing (Watkinson et al. 2017). The flow chart of the experiments is summarized in
Fig. 14.13. In brief, FPOP uses a KrF excimer laser to generate hydroxyl radicals from H 2 O 2 , which is
added to the medium in which the protein is incubated. FPOP labeling can result in a number of
covalent chemical modifications, the most common of which being the addition of an oxygen atom,
accompanied by a mass increase of 16 Da. Due to the presence of a quencher, the hydroxyl radicals
have a short lifetime of ~1 μs. They therefore irreversibly oxidize the solvent-accessible side chains of
the protein residues on a faster time scale than most protein folding/unfolding events. The labeling
pattern therefore provides a snapshot of the distribution of conformations accessible to the protein
under a given set of conditions. As compared to hydrogen/deuterium exchange, for instance, the
advantages of FPOP include the short labeling times and the irreversible nature of the chemical
modifications. The latter permits a comprehensive downstream analysis using liquid chromatography
(LC)-MS/MS methods: following labeling, the protein is subjected to proteolysis and the resulting
peptides separated and sequenced using reverse-phase LC-MS/MS, leading to the identification of the
labeled residues (Fig. 14.13).
Fig. 14.13 Principle of fast photochemical oxidation of proteins (FPOP) followed by mass spectrometry
analysis. Following a laser flash, the hydroxyl radical generated by decomposition of H 2 O 2 irreversibly
label solvent-accessible sites on the side chains of the target protein. The covalently modified protein is
digested to generate modified and unmodified tryptic peptides. LC-MS separation of the peptides is
followed by MS/MS sequencing, from which each modified residue can be identified. Modification sites
are symbolized by red circles (Adapted from Watkinson et al. 2017).
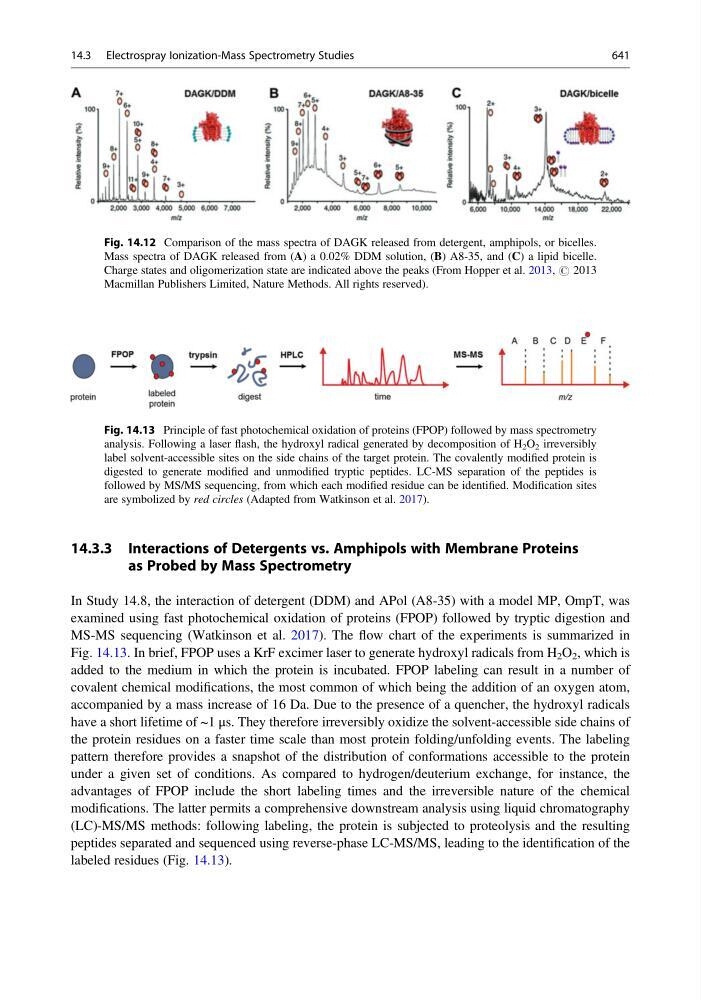
Fig. 14.12 Comparison of the mass spectra of DAGK released from detergent, amphipols, or bicelles.
Mass spectra of DAGK released from (A) a 0.02% DDM solution, (B) A8-35, and (C) a lipid bicelle.
Charge states and oligomerization state are indicated above the peaks (From Hopper et al. 2013, # 2013
Macmillan Publishers Limited, Nature Methods. All rights reserved).
14.3 Electrospray Ionization-Mass Spectrometry Studies
641