

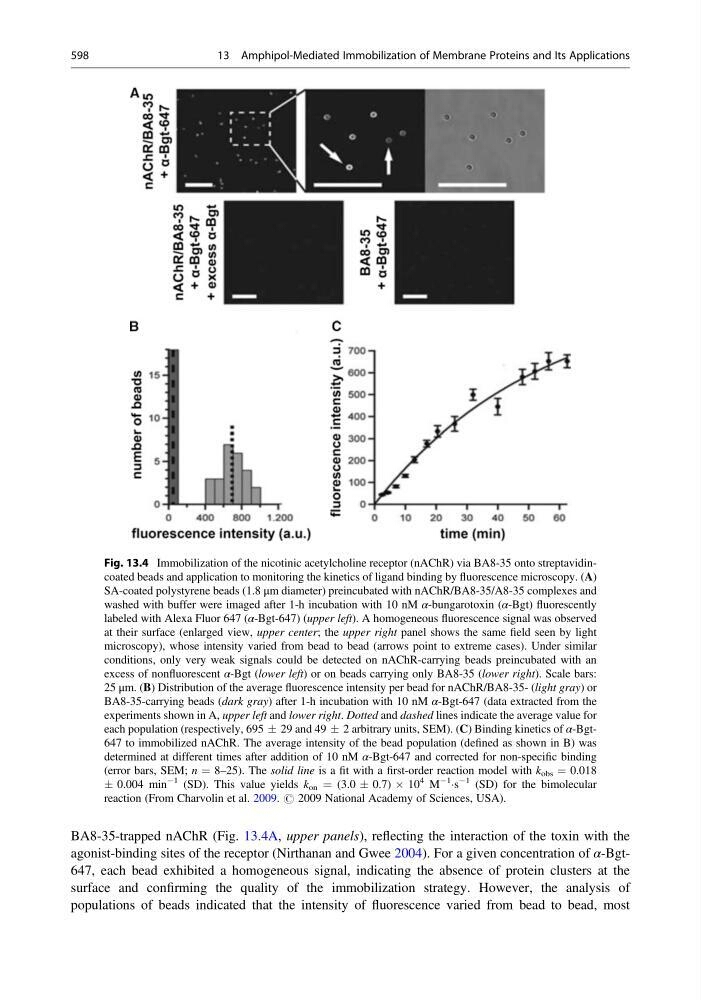
BA8-35-trapped nAChR (Fig. 13.4A, upper panels), reflecting the interaction of the toxin with the
agonist-binding sites of the receptor (Nirthanan and Gwee 2004). For a given concentration of α-Bgt647, each bead exhibited a homogeneous signal, indicating the absence of protein clusters at the
surface and confirming the quality of the immobilization strategy. However, the analysis of
populations of beads indicated that the intensity of fluorescence varied from bead to bead, most
Fig. 13.4 Immobilization of the nicotinic acetylcholine receptor (nAChR) via BA8-35 onto streptavidincoated beads and application to monitoring the kinetics of ligand binding by fluorescence microscopy. (A)
SA-coated polystyrene beads (1.8 μm diameter) preincubated with nAChR/BA8-35/A8-35 complexes and
washed with buffer were imaged after 1-h incubation with 10 nM α-bungarotoxin (α-Bgt) fluorescently
labeled with Alexa Fluor 647 (α-Bgt-647) (upper left). A homogeneous fluorescence signal was observed
at their surface (enlarged view, upper center; the upper right panel shows the same field seen by light
microscopy), whose intensity varied from bead to bead (arrows point to extreme cases). Under similar
conditions, only very weak signals could be detected on nAChR-carrying beads preincubated with an
excess of nonfluorescent α-Bgt (lower left) or on beads carrying only BA8-35 (lower right). Scale bars:
25 μm. (B) Distribution of the average fluorescence intensity per bead for nAChR/BA8-35- (light gray) or
BA8-35-carrying beads (dark gray) after 1-h incubation with 10 nM α-Bgt-647 (data extracted from the
experiments shown in A, upper left and lower right. Dotted and dashed lines indicate the average value for
each population (respectively, 695 Æ 29 and 49 Æ 2 arbitrary units, SEM). (C) Binding kinetics of α-Bgt647 to immobilized nAChR. The average intensity of the bead population (defined as shown in B) was
determined at different times after addition of 10 nM α-Bgt-647 and corrected for non-specific binding
(error bars, SEM; n ¼ 8–25). The solid line is a fit with a first-order reaction model with k obs ¼ 0.018
Æ 0.004 min
À1 (SD). This value yields k on ¼ (3.0 Æ 0.7) Â 10
4 M
À1
Ás
À1 (SD) for the bimolecular
reaction (From Charvolin et al. 2009. # 2009 National Academy of Sciences, USA).
598
13 Amphipol-Mediated Immobilization of Membrane Proteins and Its Applications