

APol-depleted tOmpA (Zoonens et al. 2007; see Chap. 5), the filaments disaggregate upon back
addition of free APol (Arunmanee et al. 2014).
The experiments shown in Fig. 12.15 were carried out with LPS-free OmpF folded in vitro from
urea-denatured inclusion bodies. Since LPS molecules are known to associate strongly with OmpF (see
Baboolal et al. 2008, and references therein) and LPS molecules can cross-link to adjacent LPS via
divalent cations such as Ca
2+ and Mg
2+ (Schneck et al. 2010), the OmpF/LPS interaction could affect
lateral OmpF association. LPS-free OmpF in detergent solution was therefore supplemented with LPS
and transferred to A8-35 in the presence or absence of 2,2
0 ,2
00 ,2
000 -(ethane-1,2-diyldinitrilo)tetraacetic
acid (EDTA). LPS-free samples and LPS-supplemented samples Æ EDTA were examined by SEC and
TEM after NS (Fig. 12.16). TEM observations confirmed the formation of OmpF/APol filaments
following removal of free APol (Fig. 12.16C). The filaments showed a beaded structure which
probably corresponds to the repetitive pattern of OmpF trimers along the chain. OmpF/APol
complexes in the presence of LPS, however, tended to assemble into sheetlike structures rather than
filaments (Fig. 12.16D), leading to small areas of apparent 2D crystallization. Once divalent cations
were chelated by EDTA, a combination of small sheetlike and filamentous structures was observed
(Fig. 12.16E). These results indicate that LPS disrupts the linear (1D) filaments formed by APoldepleted OmpF/A8-35 complexes and provokes a 2D behavior reminiscent of that in the natural
membrane, as well as of the 2D crystals formed in vitro by OmpF/lipid mixtures (Hoenger et al. 1993;
Schabert and Engel 1994; Baboolal et al. 2008). OmpF/APol complexes appear to preferably form a
type of interaction where a side-by-side, linear association of trimers takes precedence over all other
forms. However, this arrangement is easily disrupted, by LPS to form 2D sheets or by excess APol to
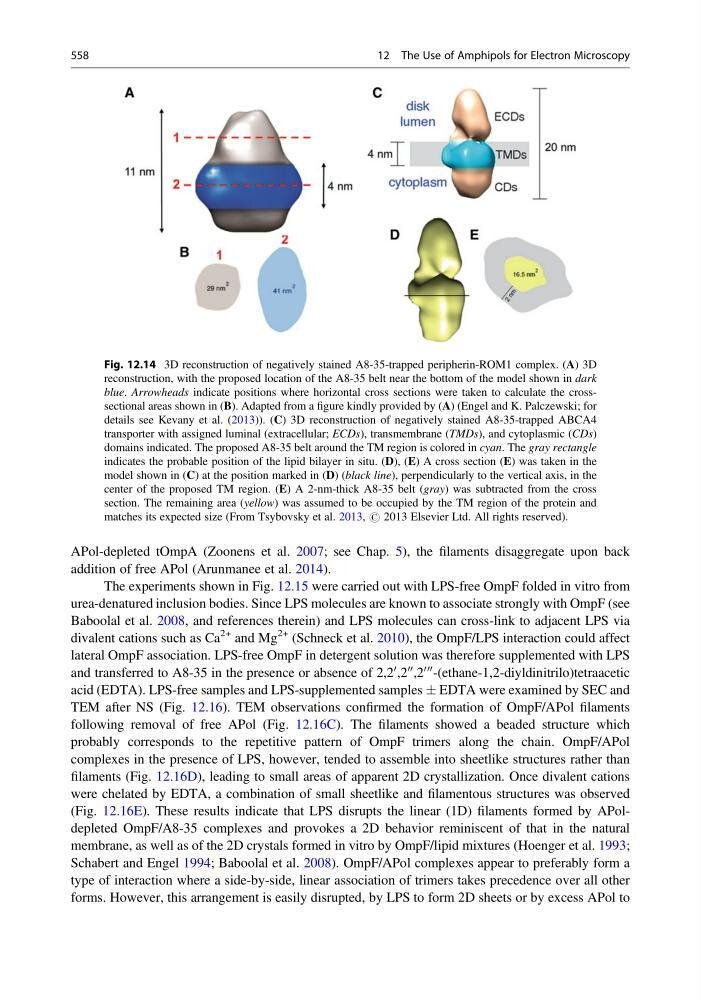
Fig. 12.14 3D reconstruction of negatively stained A8-35-trapped peripherin-ROM1 complex. (A) 3D
reconstruction, with the proposed location of the A8-35 belt near the bottom of the model shown in dark
blue. Arrowheads indicate positions where horizontal cross sections were taken to calculate the crosssectional areas shown in (B). Adapted from a figure kindly provided by (A) (Engel and K. Palczewski; for
details see Kevany et al. (2013)). (C) 3D reconstruction of negatively stained A8-35-trapped ABCA4
transporter with assigned luminal (extracellular; ECDs), transmembrane (TMDs), and cytoplasmic (CDs)
domains indicated. The proposed A8-35 belt around the TM region is colored in cyan. The gray rectangle
indicates the probable position of the lipid bilayer in situ. (D), (E) A cross section (E) was taken in the
model shown in (C) at the position marked in (D) (black line), perpendicularly to the vertical axis, in the
center of the proposed TM region. (E) A 2-nm-thick A8-35 belt (gray) was subtracted from the cross
section. The remaining area (yellow) was assumed to be occupied by the TM region of the protein and
matches its expected size (From Tsybovsky et al. 2013, # 2013 Elsevier Ltd. All rights reserved).
558
12 The Use of Amphipols for Electron Microscopy
addition of free APol (Arunmanee et al. 2014).
The experiments shown in Fig. 12.15 were carried out with LPS-free OmpF folded in vitro from
urea-denatured inclusion bodies. Since LPS molecules are known to associate strongly with OmpF (see
Baboolal et al. 2008, and references therein) and LPS molecules can cross-link to adjacent LPS via
divalent cations such as Ca
2+ and Mg
2+ (Schneck et al. 2010), the OmpF/LPS interaction could affect
lateral OmpF association. LPS-free OmpF in detergent solution was therefore supplemented with LPS
and transferred to A8-35 in the presence or absence of 2,2
0 ,2
00 ,2
000 -(ethane-1,2-diyldinitrilo)tetraacetic
acid (EDTA). LPS-free samples and LPS-supplemented samples Æ EDTA were examined by SEC and
TEM after NS (Fig. 12.16). TEM observations confirmed the formation of OmpF/APol filaments
following removal of free APol (Fig. 12.16C). The filaments showed a beaded structure which
probably corresponds to the repetitive pattern of OmpF trimers along the chain. OmpF/APol
complexes in the presence of LPS, however, tended to assemble into sheetlike structures rather than
filaments (Fig. 12.16D), leading to small areas of apparent 2D crystallization. Once divalent cations
were chelated by EDTA, a combination of small sheetlike and filamentous structures was observed
(Fig. 12.16E). These results indicate that LPS disrupts the linear (1D) filaments formed by APoldepleted OmpF/A8-35 complexes and provokes a 2D behavior reminiscent of that in the natural
membrane, as well as of the 2D crystals formed in vitro by OmpF/lipid mixtures (Hoenger et al. 1993;
Schabert and Engel 1994; Baboolal et al. 2008). OmpF/APol complexes appear to preferably form a
type of interaction where a side-by-side, linear association of trimers takes precedence over all other
forms. However, this arrangement is easily disrupted, by LPS to form 2D sheets or by excess APol to
Fig. 12.14 3D reconstruction of negatively stained A8-35-trapped peripherin-ROM1 complex. (A) 3D
reconstruction, with the proposed location of the A8-35 belt near the bottom of the model shown in dark
blue. Arrowheads indicate positions where horizontal cross sections were taken to calculate the crosssectional areas shown in (B). Adapted from a figure kindly provided by (A) (Engel and K. Palczewski; for
details see Kevany et al. (2013)). (C) 3D reconstruction of negatively stained A8-35-trapped ABCA4
transporter with assigned luminal (extracellular; ECDs), transmembrane (TMDs), and cytoplasmic (CDs)
domains indicated. The proposed A8-35 belt around the TM region is colored in cyan. The gray rectangle
indicates the probable position of the lipid bilayer in situ. (D), (E) A cross section (E) was taken in the
model shown in (C) at the position marked in (D) (black line), perpendicularly to the vertical axis, in the
center of the proposed TM region. (E) A 2-nm-thick A8-35 belt (gray) was subtracted from the cross
section. The remaining area (yellow) was assumed to be occupied by the TM region of the protein and
matches its expected size (From Tsybovsky et al. 2013, # 2013 Elsevier Ltd. All rights reserved).
558
12 The Use of Amphipols for Electron Microscopy