

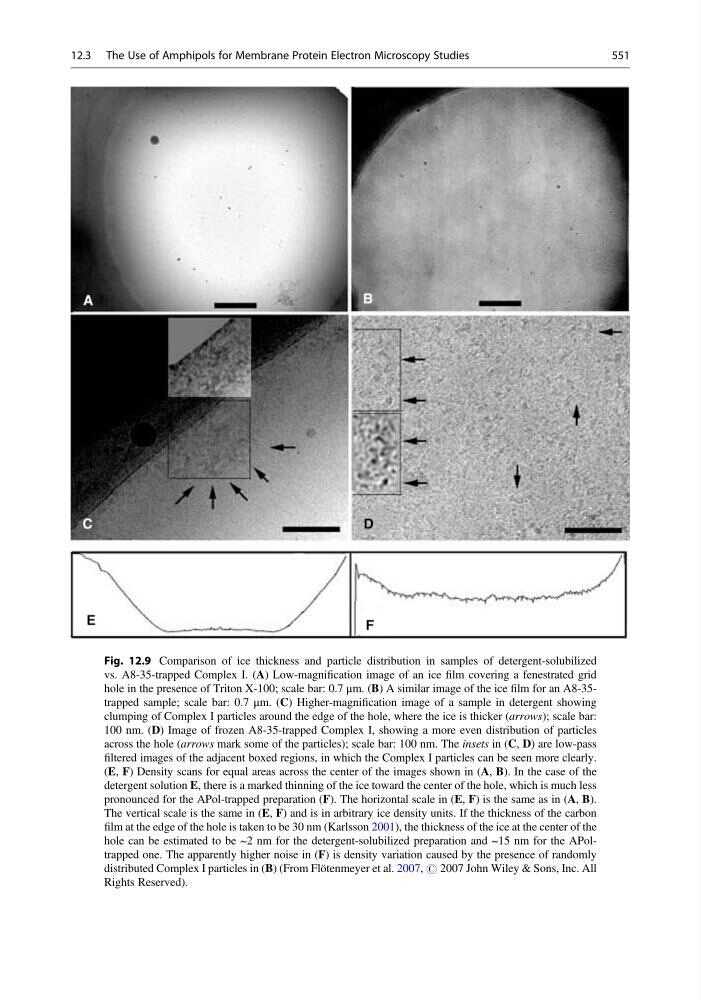
Fig. 12.9 Comparison of ice thickness and particle distribution in samples of detergent-solubilized
vs. A8-35-trapped Complex I. (A) Low-magnification image of an ice film covering a fenestrated grid
hole in the presence of Triton X-100; scale bar: 0.7 μm. (B) A similar image of the ice film for an A8-35trapped sample; scale bar: 0.7 μm. (C) Higher-magnification image of a sample in detergent showing
clumping of Complex I particles around the edge of the hole, where the ice is thicker (arrows); scale bar:
100 nm. (D) Image of frozen A8-35-trapped Complex I, showing a more even distribution of particles
across the hole (arrows mark some of the particles); scale bar: 100 nm. The insets in (C, D) are low-pass
filtered images of the adjacent boxed regions, in which the Complex I particles can be seen more clearly.
(E, F) Density scans for equal areas across the center of the images shown in (A, B). In the case of the
detergent solution E, there is a marked thinning of the ice toward the center of the hole, which is much less
pronounced for the APol-trapped preparation (F). The horizontal scale in (E, F) is the same as in (A, B).
The vertical scale is the same in (E, F) and is in arbitrary ice density units. If the thickness of the carbon
film at the edge of the hole is taken to be 30 nm (Karlsson 2001), the thickness of the ice at the center of the
hole can be estimated to be ~2 nm for the detergent-solubilized preparation and ~15 nm for the APoltrapped one. The apparently higher noise in (F) is density variation caused by the presence of randomly
distributed Complex I particles in (B) (From Flötenmeyer et al. 2007, # 2007 John Wiley & Sons, Inc. All
Rights Reserved).
12.3 The Use of Amphipols for Membrane Protein Electron Microscopy Studies
551
vs. A8-35-trapped Complex I. (A) Low-magnification image of an ice film covering a fenestrated grid
hole in the presence of Triton X-100; scale bar: 0.7 μm. (B) A similar image of the ice film for an A8-35trapped sample; scale bar: 0.7 μm. (C) Higher-magnification image of a sample in detergent showing
clumping of Complex I particles around the edge of the hole, where the ice is thicker (arrows); scale bar:
100 nm. (D) Image of frozen A8-35-trapped Complex I, showing a more even distribution of particles
across the hole (arrows mark some of the particles); scale bar: 100 nm. The insets in (C, D) are low-pass
filtered images of the adjacent boxed regions, in which the Complex I particles can be seen more clearly.
(E, F) Density scans for equal areas across the center of the images shown in (A, B). In the case of the
detergent solution E, there is a marked thinning of the ice toward the center of the hole, which is much less
pronounced for the APol-trapped preparation (F). The horizontal scale in (E, F) is the same as in (A, B).
The vertical scale is the same in (E, F) and is in arbitrary ice density units. If the thickness of the carbon
film at the edge of the hole is taken to be 30 nm (Karlsson 2001), the thickness of the ice at the center of the
hole can be estimated to be ~2 nm for the detergent-solubilized preparation and ~15 nm for the APoltrapped one. The apparently higher noise in (F) is density variation caused by the presence of randomly
distributed Complex I particles in (B) (From Flötenmeyer et al. 2007, # 2007 John Wiley & Sons, Inc. All
Rights Reserved).
12.3 The Use of Amphipols for Membrane Protein Electron Microscopy Studies
551