

Box 9.2 (continued)
but different shapes, namely spheres (black), oblate (lenticular) ellipsoids (green), and
prolate (cigar-like) ellipsoids (blue). The difference is due to interference between
photons or neutrons scattered by different points within each particle. By Fourier
transformation, one obtains the pair-distance distribution function, p(r) (Fig. 9.18B),
which describes the probability of observing a given distance r between two points
within a particle. Analysis of this function provides precious shape information. It is
obvious, for instance, that if one distorts a sphere into a cigar, the function p(r) will
extend to longer distances, corresponding to those between scatterers located at the two
ends of the cigar: compare the black curve (spheres) with the blue one (prolate ellipsoids)
in Fig. 9.18B. Comparing experimental scattering curves and p(r) functions with those of
models is a powerful approach to studying the shape of particles and determining, for
instance, the arrangement of two protomers into a dimer. Computer programs permit ab
initio constructions of models by adjusting particle shapes created in silico to optimize
the fit of predicted to experimental scattering curves (see e.g. Figs. 9.21 and 9.22).
• Information on the dynamics of the particles. The low-energy (“thermal”) neutrons used
in scattering experiments can exchange with the nuclei they interact with amounts of
energy that are measurable as a change in their wavelength and speed. These contain
information about the diffusion of the particles as a whole (“quasi-elastic” scattering), as
well as about the vibrations of atoms or groups of atoms within them (“inelastic”
scattering). This approach can be used to measure the translational diffusion coefficient
D t of the particles, as well as to determine whether they are “hard” or “soft,” such as
below or above a phase transition from viscous to liquid-like (cf. § 4.3.1.2.4 in Chap. 4).
0 10 20 30 40 50 60 70 80 90 100
100
80
23.5 ± 1
85.1 ± 2.5
60
DAPoI
HAPoI
40
20
0
-2×10 -11
-2×10 -11
-1×10 -11
-5×10 -12
√(NAI(0)/ c
2 )
5×10 -12
1×10 -11
2×10 -11
0
9.0
8.0
7.0
6.0
5.0
4.0
3.0
2.0
1.0
0.0
-1.0
D2O (% v/v)
D2O (% v/v)
Scattering length density 10 10
cm -2
Deuterated DNA
Deuterated protein
DNA
RNA
Protein
Water
Phosphatidylcholine
B
A
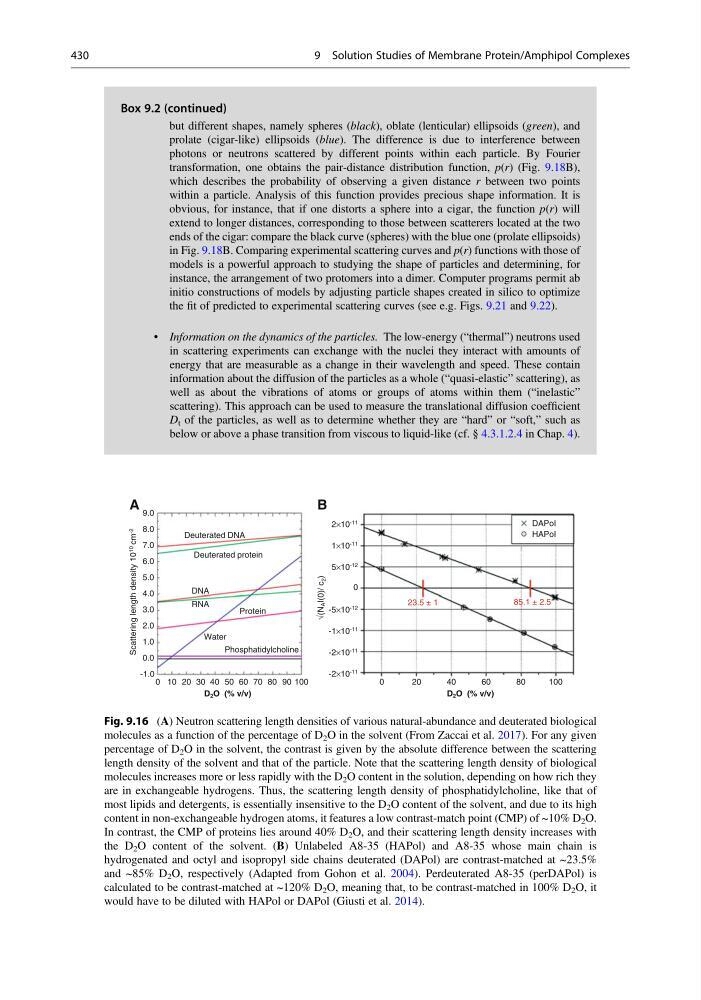
Fig. 9.16 (A) Neutron scattering length densities of various natural-abundance and deuterated biological
molecules as a function of the percentage of D 2 O in the solvent (From Zaccai et al. 2017). For any given
percentage of D 2 O in the solvent, the contrast is given by the absolute difference between the scattering
length density of the solvent and that of the particle. Note that the scattering length density of biological
molecules increases more or less rapidly with the D 2 O content in the solution, depending on how rich they
are in exchangeable hydrogens. Thus, the scattering length density of phosphatidylcholine, like that of
most lipids and detergents, is essentially insensitive to the D 2 O content of the solvent, and due to its high
content in non-exchangeable hydrogen atoms, it features a low contrast-match point (CMP) of ~10% D 2 O.
In contrast, the CMP of proteins lies around 40% D 2 O, and their scattering length density increases with
the D 2 O content of the solvent. (B) Unlabeled A8-35 (HAPol) and A8-35 whose main chain is
hydrogenated and octyl and isopropyl side chains deuterated (DAPol) are contrast-matched at ~23.5%
and ~85% D 2 O, respectively (Adapted from Gohon et al. 2004). Perdeuterated A8-35 (perDAPol) is
calculated to be contrast-matched at ~120% D 2 O, meaning that, to be contrast-matched in 100% D 2 O, it
would have to be diluted with HAPol or DAPol (Giusti et al. 2014).
430
9 Solution Studies of Membrane Protein/Amphipol Complexes
but different shapes, namely spheres (black), oblate (lenticular) ellipsoids (green), and
prolate (cigar-like) ellipsoids (blue). The difference is due to interference between
photons or neutrons scattered by different points within each particle. By Fourier
transformation, one obtains the pair-distance distribution function, p(r) (Fig. 9.18B),
which describes the probability of observing a given distance r between two points
within a particle. Analysis of this function provides precious shape information. It is
obvious, for instance, that if one distorts a sphere into a cigar, the function p(r) will
extend to longer distances, corresponding to those between scatterers located at the two
ends of the cigar: compare the black curve (spheres) with the blue one (prolate ellipsoids)
in Fig. 9.18B. Comparing experimental scattering curves and p(r) functions with those of
models is a powerful approach to studying the shape of particles and determining, for
instance, the arrangement of two protomers into a dimer. Computer programs permit ab
initio constructions of models by adjusting particle shapes created in silico to optimize
the fit of predicted to experimental scattering curves (see e.g. Figs. 9.21 and 9.22).
• Information on the dynamics of the particles. The low-energy (“thermal”) neutrons used
in scattering experiments can exchange with the nuclei they interact with amounts of
energy that are measurable as a change in their wavelength and speed. These contain
information about the diffusion of the particles as a whole (“quasi-elastic” scattering), as
well as about the vibrations of atoms or groups of atoms within them (“inelastic”
scattering). This approach can be used to measure the translational diffusion coefficient
D t of the particles, as well as to determine whether they are “hard” or “soft,” such as
below or above a phase transition from viscous to liquid-like (cf. § 4.3.1.2.4 in Chap. 4).
0 10 20 30 40 50 60 70 80 90 100
100
80
23.5 ± 1
85.1 ± 2.5
60
DAPoI
HAPoI
40
20
0
-2×10 -11
-2×10 -11
-1×10 -11
-5×10 -12
√(NAI(0)/ c
2 )
5×10 -12
1×10 -11
2×10 -11
0
9.0
8.0
7.0
6.0
5.0
4.0
3.0
2.0
1.0
0.0
-1.0
D2O (% v/v)
D2O (% v/v)
Scattering length density 10 10
cm -2
Deuterated DNA
Deuterated protein
DNA
RNA
Protein
Water
Phosphatidylcholine
B
A
Fig. 9.16 (A) Neutron scattering length densities of various natural-abundance and deuterated biological
molecules as a function of the percentage of D 2 O in the solvent (From Zaccai et al. 2017). For any given
percentage of D 2 O in the solvent, the contrast is given by the absolute difference between the scattering
length density of the solvent and that of the particle. Note that the scattering length density of biological
molecules increases more or less rapidly with the D 2 O content in the solution, depending on how rich they
are in exchangeable hydrogens. Thus, the scattering length density of phosphatidylcholine, like that of
most lipids and detergents, is essentially insensitive to the D 2 O content of the solvent, and due to its high
content in non-exchangeable hydrogen atoms, it features a low contrast-match point (CMP) of ~10% D 2 O.
In contrast, the CMP of proteins lies around 40% D 2 O, and their scattering length density increases with
the D 2 O content of the solvent. (B) Unlabeled A8-35 (HAPol) and A8-35 whose main chain is
hydrogenated and octyl and isopropyl side chains deuterated (DAPol) are contrast-matched at ~23.5%
and ~85% D 2 O, respectively (Adapted from Gohon et al. 2004). Perdeuterated A8-35 (perDAPol) is
calculated to be contrast-matched at ~120% D 2 O, meaning that, to be contrast-matched in 100% D 2 O, it
would have to be diluted with HAPol or DAPol (Giusti et al. 2014).
430
9 Solution Studies of Membrane Protein/Amphipol Complexes