

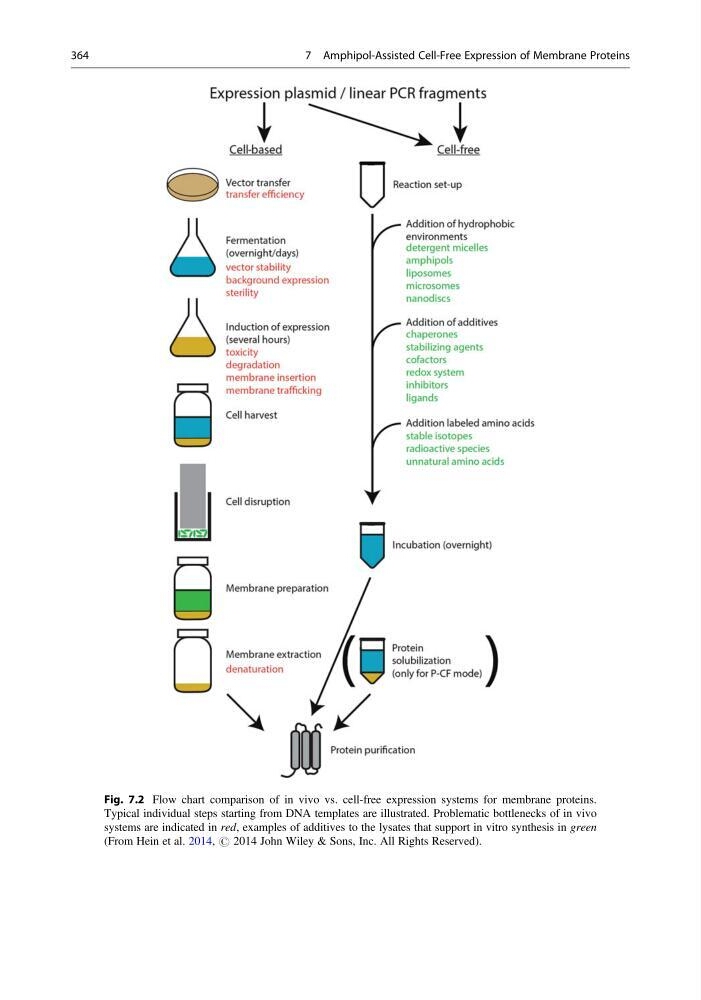
Fig. 7.2 Flow chart comparison of in vivo vs. cell-free expression systems for membrane proteins.
Typical individual steps starting from DNA templates are illustrated. Problematic bottlenecks of in vivo
systems are indicated in red, examples of additives to the lysates that support in vitro synthesis in green
(From Hein et al. 2014, # 2014 John Wiley & Sons, Inc. All Rights Reserved).
364
7 Amphipol-Assisted Cell-Free Expression of Membrane Proteins
Typical individual steps starting from DNA templates are illustrated. Problematic bottlenecks of in vivo
systems are indicated in red, examples of additives to the lysates that support in vitro synthesis in green
(From Hein et al. 2014, # 2014 John Wiley & Sons, Inc. All Rights Reserved).
364
7 Amphipol-Assisted Cell-Free Expression of Membrane Proteins