

energy of activation of the limiting step in the enzymatic cycle. The latter, which, under most
circumstances, corresponds to the transition between the E1P and E2P states (Champeil et al. 1986)
(step ③ in Fig. 1.32, Chap. 1), is accompanied by large transmembrane (and extramembrane)
rearrangements (reviewed in Møller et al. 2010; for a recent description, see Norimatsu et al. 2017).
Box 5.3 Estimating the Composition of Mixed Micelles and Protein-Bound
Surfactant Belts in Amphipol/Detergent Mixtures
In order to understand the behavior of MPs exposed to amphipol/detergent mixtures, as is the case
of several of the experiments described in this section, it is useful to estimate the composition of the
surfactant belt they are exposed to. This is not simply given by the global mass ratio of APol to
detergent in the sample, because some of the detergent will always be present as monomers. Some
of the APol is as well, but the CAC is so low (~0.002 gÁL-1 for A8-35; Giusti et al. 2012; see
Chap. 4, § 4.3.1.1) that it can usually be neglected. Experiments carried out in the presence of APol/
detergent mixtures, e.g. A8-35/DDM ones, show that (i) the two surfactants mix close to ideally
and (ii) the composition of the protein-bound surfactant belt is related to that of protein-free mixed
micelles by a partition coefficient P with a relatively low value (Zoonens et al. 2007; Tribet et al.
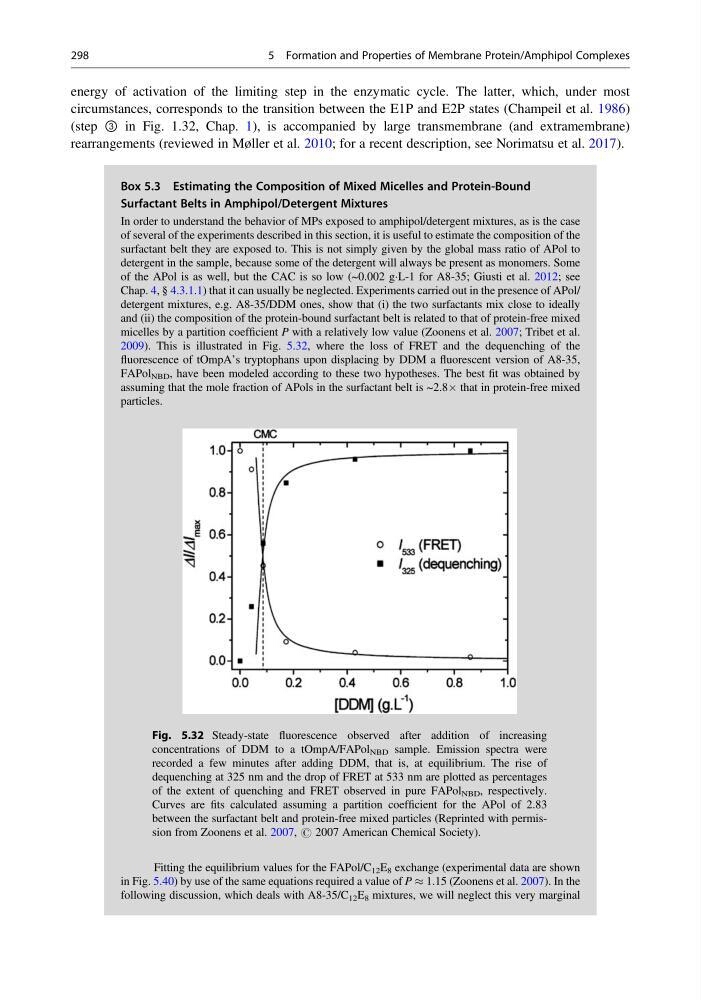
2009). This is illustrated in Fig. 5.32, where the loss of FRET and the dequenching of the
fluorescence of tOmpA’s tryptophans upon displacing by DDM a fluorescent version of A8-35,
FAPol NBD , have been modeled according to these two hypotheses. The best fit was obtained by
assuming that the mole fraction of APols in the surfactant belt is ~2.8Â that in protein-free mixed
particles.
Fitting the equilibrium values for the FAPol/C 12 E 8 exchange (experimental data are shown
in Fig. 5.40) by use of the same equations required a value of P % 1.15 (Zoonens et al. 2007). In the
following discussion, which deals with A8-35/C 12 E 8 mixtures, we will neglect this very marginal
Fig. 5.32 Steady-state fluorescence observed after addition of increasing
concentrations of DDM to a tOmpA/FAPol NBD sample. Emission spectra were
recorded a few minutes after adding DDM, that is, at equilibrium. The rise of
dequenching at 325 nm and the drop of FRET at 533 nm are plotted as percentages
of the extent of quenching and FRET observed in pure FAPol NBD , respectively.
Curves are fits calculated assuming a partition coefficient for the APol of 2.83
between the surfactant belt and protein-free mixed particles (Reprinted with permission from Zoonens et al. 2007, # 2007 American Chemical Society).
298
5 Formation and Properties of Membrane Protein/Amphipol Complexes
circumstances, corresponds to the transition between the E1P and E2P states (Champeil et al. 1986)
(step ③ in Fig. 1.32, Chap. 1), is accompanied by large transmembrane (and extramembrane)
rearrangements (reviewed in Møller et al. 2010; for a recent description, see Norimatsu et al. 2017).
Box 5.3 Estimating the Composition of Mixed Micelles and Protein-Bound
Surfactant Belts in Amphipol/Detergent Mixtures
In order to understand the behavior of MPs exposed to amphipol/detergent mixtures, as is the case
of several of the experiments described in this section, it is useful to estimate the composition of the
surfactant belt they are exposed to. This is not simply given by the global mass ratio of APol to
detergent in the sample, because some of the detergent will always be present as monomers. Some
of the APol is as well, but the CAC is so low (~0.002 gÁL-1 for A8-35; Giusti et al. 2012; see
Chap. 4, § 4.3.1.1) that it can usually be neglected. Experiments carried out in the presence of APol/
detergent mixtures, e.g. A8-35/DDM ones, show that (i) the two surfactants mix close to ideally
and (ii) the composition of the protein-bound surfactant belt is related to that of protein-free mixed
micelles by a partition coefficient P with a relatively low value (Zoonens et al. 2007; Tribet et al.
2009). This is illustrated in Fig. 5.32, where the loss of FRET and the dequenching of the
fluorescence of tOmpA’s tryptophans upon displacing by DDM a fluorescent version of A8-35,
FAPol NBD , have been modeled according to these two hypotheses. The best fit was obtained by
assuming that the mole fraction of APols in the surfactant belt is ~2.8Â that in protein-free mixed
particles.
Fitting the equilibrium values for the FAPol/C 12 E 8 exchange (experimental data are shown
in Fig. 5.40) by use of the same equations required a value of P % 1.15 (Zoonens et al. 2007). In the
following discussion, which deals with A8-35/C 12 E 8 mixtures, we will neglect this very marginal
Fig. 5.32 Steady-state fluorescence observed after addition of increasing
concentrations of DDM to a tOmpA/FAPol NBD sample. Emission spectra were
recorded a few minutes after adding DDM, that is, at equilibrium. The rise of
dequenching at 325 nm and the drop of FRET at 533 nm are plotted as percentages
of the extent of quenching and FRET observed in pure FAPol NBD , respectively.
Curves are fits calculated assuming a partition coefficient for the APol of 2.83
between the surfactant belt and protein-free mixed particles (Reprinted with permission from Zoonens et al. 2007, # 2007 American Chemical Society).
298
5 Formation and Properties of Membrane Protein/Amphipol Complexes