

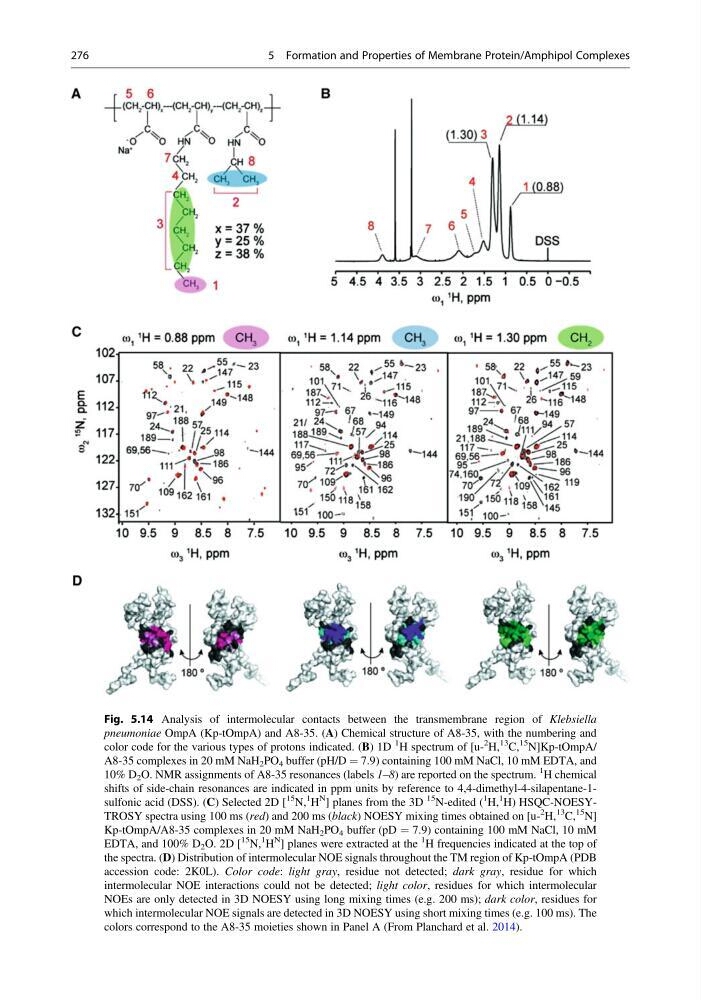
Fig. 5.14 Analysis of intermolecular contacts between the transmembrane region of Klebsiella
pneumoniae OmpA (Kp-tOmpA) and A8-35. (A) Chemical structure of A8-35, with the numbering and
color code for the various types of protons indicated. (B) 1D
1
H spectrum of [u2
H,
13
C,
15
N]Kp-tOmpA/
A8-35 complexes in 20 mM NaH 2 PO 4 buffer (pH/D ¼ 7.9) containing 100 mM NaCl, 10 mM EDTA, and
10% D 2 O. NMR assignments of A8-35 resonances (labels 1–8) are reported on the spectrum.
1
H chemical
shifts of side-chain resonances are indicated in ppm units by reference to 4,4-dimethyl-4-silapentane-1sulfonic acid (DSS). (C) Selected 2D [
15
N,
1
H
N
] planes from the 3D
15 N-edited (
1
H,
1
H) HSQC-NOESYTROSY spectra using 100 ms (red) and 200 ms (black) NOESY mixing times obtained on [u2
H,
13
C,
15
N]
Kp-tOmpA/A8-35 complexes in 20 mM NaH 2 PO 4 buffer (pD ¼ 7.9) containing 100 mM NaCl, 10 mM
EDTA, and 100% D 2 O. 2D [
15
N,
1
H
N
] planes were extracted at the
1
H frequencies indicated at the top of
the spectra. (D) Distribution of intermolecular NOE signals throughout the TM region of Kp-tOmpA (PDB
accession code: 2K0L). Color code: light gray, residue not detected; dark gray, residue for which
intermolecular NOE interactions could not be detected; light color, residues for which intermolecular
NOEs are only detected in 3D NOESY using long mixing times (e.g. 200 ms); dark color, residues for
which intermolecular NOE signals are detected in 3D NOESY using short mixing times (e.g. 100 ms). The
colors correspond to the A8-35 moieties shown in Panel A (From Planchard et al. 2014).
276
5 Formation and Properties of Membrane Protein/Amphipol Complexes
pneumoniae OmpA (Kp-tOmpA) and A8-35. (A) Chemical structure of A8-35, with the numbering and
color code for the various types of protons indicated. (B) 1D
1
H spectrum of [u2
H,
13
C,
15
N]Kp-tOmpA/
A8-35 complexes in 20 mM NaH 2 PO 4 buffer (pH/D ¼ 7.9) containing 100 mM NaCl, 10 mM EDTA, and
10% D 2 O. NMR assignments of A8-35 resonances (labels 1–8) are reported on the spectrum.
1
H chemical
shifts of side-chain resonances are indicated in ppm units by reference to 4,4-dimethyl-4-silapentane-1sulfonic acid (DSS). (C) Selected 2D [
15
N,
1
H
N
] planes from the 3D
15 N-edited (
1
H,
1
H) HSQC-NOESYTROSY spectra using 100 ms (red) and 200 ms (black) NOESY mixing times obtained on [u2
H,
13
C,
15
N]
Kp-tOmpA/A8-35 complexes in 20 mM NaH 2 PO 4 buffer (pD ¼ 7.9) containing 100 mM NaCl, 10 mM
EDTA, and 100% D 2 O. 2D [
15
N,
1
H
N
] planes were extracted at the
1
H frequencies indicated at the top of
the spectra. (D) Distribution of intermolecular NOE signals throughout the TM region of Kp-tOmpA (PDB
accession code: 2K0L). Color code: light gray, residue not detected; dark gray, residue for which
intermolecular NOE interactions could not be detected; light color, residues for which intermolecular
NOEs are only detected in 3D NOESY using long mixing times (e.g. 200 ms); dark color, residues for
which intermolecular NOE signals are detected in 3D NOESY using short mixing times (e.g. 100 ms). The
colors correspond to the A8-35 moieties shown in Panel A (From Planchard et al. 2014).
276
5 Formation and Properties of Membrane Protein/Amphipol Complexes