

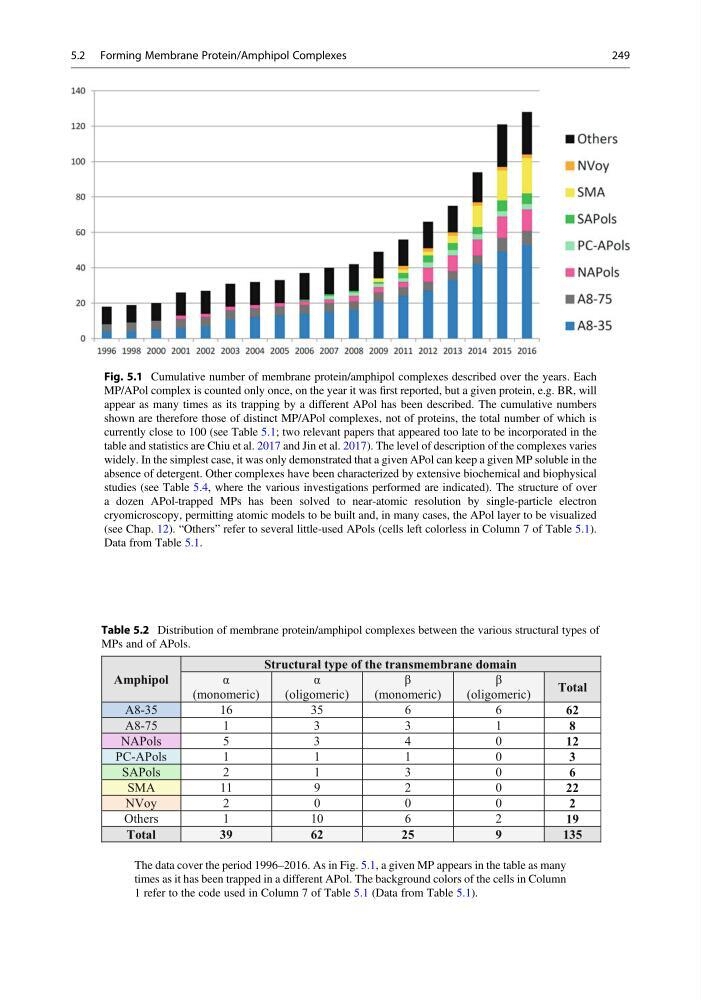
Fig. 5.1 Cumulative number of membrane protein/amphipol complexes described over the years. Each
MP/APol complex is counted only once, on the year it was first reported, but a given protein, e.g. BR, will
appear as many times as its trapping by a different APol has been described. The cumulative numbers
shown are therefore those of distinct MP/APol complexes, not of proteins, the total number of which is
currently close to 100 (see Table 5.1; two relevant papers that appeared too late to be incorporated in the
table and statistics are Chiu et al. 2017 and Jin et al. 2017). The level of description of the complexes varies
widely. In the simplest case, it was only demonstrated that a given APol can keep a given MP soluble in the
absence of detergent. Other complexes have been characterized by extensive biochemical and biophysical
studies (see Table 5.4, where the various investigations performed are indicated). The structure of over
a dozen APol-trapped MPs has been solved to near-atomic resolution by single-particle electron
cryomicroscopy, permitting atomic models to be built and, in many cases, the APol layer to be visualized
(see Chap. 12). “Others” refer to several little-used APols (cells left colorless in Column 7 of Table 5.1).
Data from Table 5.1.
Table 5.2 Distribution of membrane protein/amphipol complexes between the various structural types of
MPs and of APols.
Amphipol
Structural type of the transmembrane domain
α
(monomeric)
α
(oligomeric)
β
(monomeric)
β
(oligomeric)
Total
A8-35
16
35
6
6
62
A8-75
1
3
3
1
8
NAPols
5
3
4
0
12
PC-APols
1
1
1
0
3
SAPols
2
1
3
0
6
SMA
11
9
2
0
22
NVoy
2
0
0
0
2
Others
1
10
6
2
19
Total
39
62
25
9
135
The data cover the period 1996–2016. As in Fig. 5.1, a given MP appears in the table as many
times as it has been trapped in a different APol. The background colors of the cells in Column
1 refer to the code used in Column 7 of Table 5.1 (Data from Table 5.1).
5.2 Forming Membrane Protein/Amphipol Complexes
249
MP/APol complex is counted only once, on the year it was first reported, but a given protein, e.g. BR, will
appear as many times as its trapping by a different APol has been described. The cumulative numbers
shown are therefore those of distinct MP/APol complexes, not of proteins, the total number of which is
currently close to 100 (see Table 5.1; two relevant papers that appeared too late to be incorporated in the
table and statistics are Chiu et al. 2017 and Jin et al. 2017). The level of description of the complexes varies
widely. In the simplest case, it was only demonstrated that a given APol can keep a given MP soluble in the
absence of detergent. Other complexes have been characterized by extensive biochemical and biophysical
studies (see Table 5.4, where the various investigations performed are indicated). The structure of over
a dozen APol-trapped MPs has been solved to near-atomic resolution by single-particle electron
cryomicroscopy, permitting atomic models to be built and, in many cases, the APol layer to be visualized
(see Chap. 12). “Others” refer to several little-used APols (cells left colorless in Column 7 of Table 5.1).
Data from Table 5.1.
Table 5.2 Distribution of membrane protein/amphipol complexes between the various structural types of
MPs and of APols.
Amphipol
Structural type of the transmembrane domain
α
(monomeric)
α
(oligomeric)
β
(monomeric)
β
(oligomeric)
Total
A8-35
16
35
6
6
62
A8-75
1
3
3
1
8
NAPols
5
3
4
0
12
PC-APols
1
1
1
0
3
SAPols
2
1
3
0
6
SMA
11
9
2
0
22
NVoy
2
0
0
0
2
Others
1
10
6
2
19
Total
39
62
25
9
135
The data cover the period 1996–2016. As in Fig. 5.1, a given MP appears in the table as many
times as it has been trapped in a different APol. The background colors of the cells in Column
1 refer to the code used in Column 7 of Table 5.1 (Data from Table 5.1).
5.2 Forming Membrane Protein/Amphipol Complexes
249