

4.3 Phase Separation of Lipid Bilayer Membranes
Characteristic of phase equilibrium of two components system is shown in
temperature-component phase diagram. When two components, A and B are
completely miscible in both gel phase and fluid phase, single gel phase exist
below solidus curve and single fluid phase exists above solidus curve. Composition
in these phases does not depend on temperature but is determined by molar ratio of
each component. Phase diagram of ideal solution of two components was obtained
by Seltz using graphical method [11]. A. G. Lee obtained phase diagram in non-ideal
mixing of two components as follows [12]. In ideal binary system, chemical
potential of component A in liquid phase is shown as μ
ideal
A
¼ μ
0
A þ RTlog e x
liquid
A
,
and assuming two components is completely immiscible in solid phase, freezing
point is obtained as log e x
liquid
A
¼
ΔH A
R
1
T A
À
1
T
. On the other hand, Gibbs free
energy of chemical potential in non-ideal mixing is shown as μ A ¼ G þ 1 À x A
ð
Þ
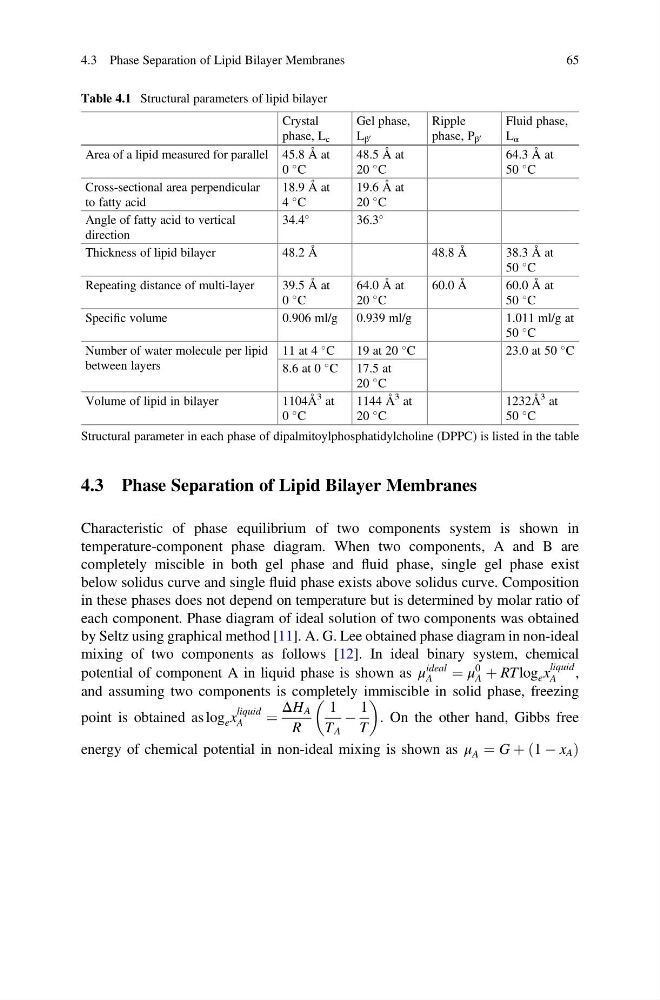
Table 4.1 Structural parameters of lipid bilayer
Crystal
phase, L c
Gel phase,
L β
0
Ripple
phase, P β
0
Fluid phase,
L α
Area of a lipid measured for parallel 45.8 Å at
0
C
48.5 Å at
20
C
64.3 Å at
50
C
Cross-sectional area perpendicular
to fatty acid
18.9 Å at
4
C
19.6 Å at
20
C
Angle of fatty acid to vertical
direction
34.4
36.3
Thickness of lipid bilayer
48.2 Å
48.8 Å
38.3 Å at
50
C
Repeating distance of multi-layer
39.5 Å at
0
C
64.0 Å at
20
C
60.0 Å
60.0 Å at
50
C
Specific volume
0.906 ml/g 0.939 ml/g
1.011 ml/g at
50
C
Number of water molecule per lipid
between layers
11 at 4
C
19at20
C
23.0 at 50
C
8.6 at 0
C 17.5 at
20
C
Volume of lipid in bilayer
1104Å
3 at
0
C
1144 Å
3 at
20
C
1232Å
3 at
50
C
Structural parameter in each phase of dipalmitoylphosphatidylcholine (DPPC) is listed in the table
4.3 Phase Separation of Lipid Bilayer Membranes
65
Characteristic of phase equilibrium of two components system is shown in
temperature-component phase diagram. When two components, A and B are
completely miscible in both gel phase and fluid phase, single gel phase exist
below solidus curve and single fluid phase exists above solidus curve. Composition
in these phases does not depend on temperature but is determined by molar ratio of
each component. Phase diagram of ideal solution of two components was obtained
by Seltz using graphical method [11]. A. G. Lee obtained phase diagram in non-ideal
mixing of two components as follows [12]. In ideal binary system, chemical
potential of component A in liquid phase is shown as μ
ideal
A
¼ μ
0
A þ RTlog e x
liquid
A
,
and assuming two components is completely immiscible in solid phase, freezing
point is obtained as log e x
liquid
A
¼
ΔH A
R
1
T A
À
1
T
. On the other hand, Gibbs free
energy of chemical potential in non-ideal mixing is shown as μ A ¼ G þ 1 À x A
ð
Þ
Table 4.1 Structural parameters of lipid bilayer
Crystal
phase, L c
Gel phase,
L β
0
Ripple
phase, P β
0
Fluid phase,
L α
Area of a lipid measured for parallel 45.8 Å at
0
C
48.5 Å at
20
C
64.3 Å at
50
C
Cross-sectional area perpendicular
to fatty acid
18.9 Å at
4
C
19.6 Å at
20
C
Angle of fatty acid to vertical
direction
34.4
36.3
Thickness of lipid bilayer
48.2 Å
48.8 Å
38.3 Å at
50
C
Repeating distance of multi-layer
39.5 Å at
0
C
64.0 Å at
20
C
60.0 Å
60.0 Å at
50
C
Specific volume
0.906 ml/g 0.939 ml/g
1.011 ml/g at
50
C
Number of water molecule per lipid
between layers
11 at 4
C
19at20
C
23.0 at 50
C
8.6 at 0
C 17.5 at
20
C
Volume of lipid in bilayer
1104Å
3 at
0
C
1144 Å
3 at
20
C
1232Å
3 at
50
C
Structural parameter in each phase of dipalmitoylphosphatidylcholine (DPPC) is listed in the table
4.3 Phase Separation of Lipid Bilayer Membranes
65