

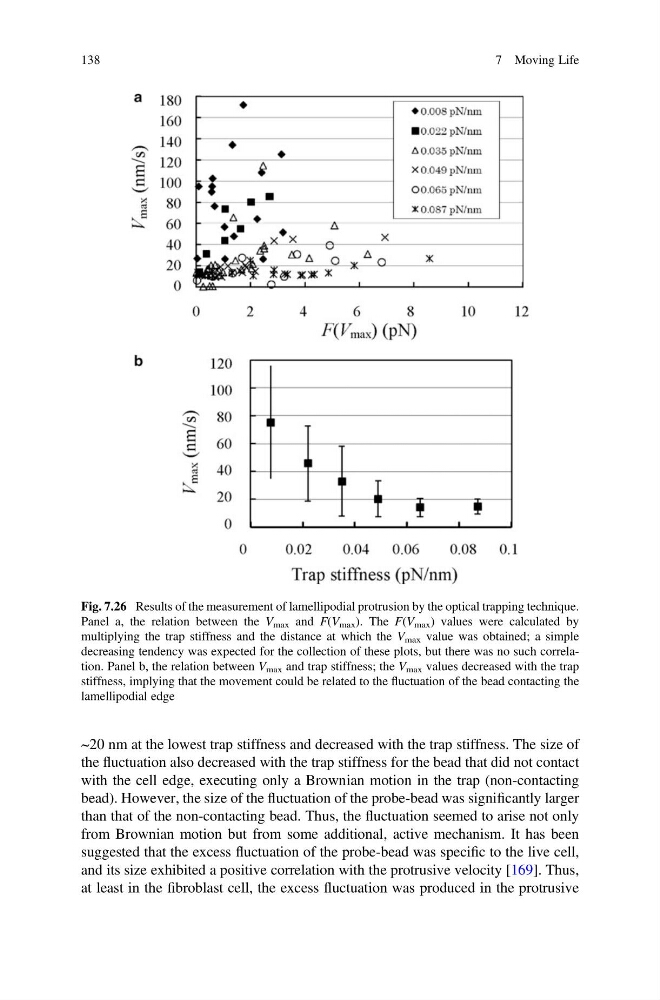
~20 nm at the lowest trap stiffness and decreased with the trap stiffness. The size of
the fluctuation also decreased with the trap stiffness for the bead that did not contact
with the cell edge, executing only a Brownian motion in the trap (non-contacting
bead). However, the size of the fluctuation of the probe-bead was significantly larger
than that of the non-contacting bead. Thus, the fluctuation seemed to arise not only
from Brownian motion but from some additional, active mechanism. It has been
suggested that the excess fluctuation of the probe-bead was specific to the live cell,
and its size exhibited a positive correlation with the protrusive velocity [169]. Thus,
at least in the fibroblast cell, the excess fluctuation was produced in the protrusive
Fig. 7.26 Results of the measurement of lamellipodial protrusion by the optical trapping technique.
Panel a, the relation between the V max and F(V max ). The F(V max ) values were calculated by
multiplying the trap stiffness and the distance at which the V max value was obtained; a simple
decreasing tendency was expected for the collection of these plots, but there was no such correlation. Panel b, the relation between V max and trap stiffness; the V max values decreased with the trap
stiffness, implying that the movement could be related to the fluctuation of the bead contacting the
lamellipodial edge
138
7 Moving Life
the fluctuation also decreased with the trap stiffness for the bead that did not contact
with the cell edge, executing only a Brownian motion in the trap (non-contacting
bead). However, the size of the fluctuation of the probe-bead was significantly larger
than that of the non-contacting bead. Thus, the fluctuation seemed to arise not only
from Brownian motion but from some additional, active mechanism. It has been
suggested that the excess fluctuation of the probe-bead was specific to the live cell,
and its size exhibited a positive correlation with the protrusive velocity [169]. Thus,
at least in the fibroblast cell, the excess fluctuation was produced in the protrusive
Fig. 7.26 Results of the measurement of lamellipodial protrusion by the optical trapping technique.
Panel a, the relation between the V max and F(V max ). The F(V max ) values were calculated by
multiplying the trap stiffness and the distance at which the V max value was obtained; a simple
decreasing tendency was expected for the collection of these plots, but there was no such correlation. Panel b, the relation between V max and trap stiffness; the V max values decreased with the trap
stiffness, implying that the movement could be related to the fluctuation of the bead contacting the
lamellipodial edge
138
7 Moving Life